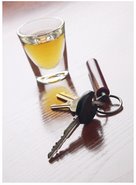
Diabetics commonly experience hypoglycemia (low blood sugar levels). And what are the symptoms? Slow and slurred speech, poor balance, impaired motor control, staggering, drowsiness, flushed face, disorientation -- in other words, the classic symptoms of alcohol intoxication. This individual will look and act like a drunk driver to the officer, and will certainly fail any DUI "field sobriety tests". As one expert has observed, "Hypoglycemia (abnormally low levels of blood glucose) is frequently seen in connection with driving error on this nation’s roads and highways...Even more frequent are unjustified DUIs or DWIs, stemming from hypoglycemic symptoms that can closely mimic those of a drunk driver." From "Hypoglycemia: Driving Under the Influence" in 8(1) Medical and Toxicological Information Review Sept. 2003.
Canadian scientists have reported that "approximately 200 compounds have been detected in the human breath." Manolis, The Diagnostic Potential of Breath Analysis, 29(1) Clinical Chemistry 5 (1983).
This study confirmed the presence of acetone on the breath in diabetics and in persons on a diet " associated with a weight reduction of about one-half pound per week." Id. at 9. Another study has confirmed that diabetics may give false indications of intoxication. In Brick, Diabetes, Breath Acetone and Breathalyzer Accuracy: A Case Study, 9(1) Alcohol, Drugs and Driving (1993), a researcher found that expired ketones in the breath of an untreated diabetic can contribute to erroneously high breath-alcohol readings. Further, the acetone on the breath from ketoacidosis will result in an odor of alcohol. Finally, behavioral patterns of a diabetic whose blood-sugar level has dropped will include slurred speech, slow gait, impaired motor control, fumbling hand movements, and mental confusion--all symptomatic of intoxication.
Acetone may also be found on the breath of perfectly normal, healthy individuals. Yet, acetone is one of the compounds that will be detected on many breath analyzing instruments as ethanol. In the Intoxilyzer, for example, it is detected because acetone absorbs infrared energy in the 3.38 to 3.40 micron range--the same range where ethanol is found. Therefore, if acetone were introduced into the Intoxilyzer, the machine would simply register the presence of alcohol despite its absence. If an individual had 525 micrograms per liter of acetone in the breath, he would register a blood-alcohol level of .02 to .03 percent. Thus, if an individual with a true blood-alcohol level of .08 percent had that amount of acetone, the Intoxilyzer would register in the area of .l0 to .11 percent.
The National Highway Traffic Safety Administration has published a report entitled The Likelihood of Acetone Interference in Breath Alcohol Measurement (DOT HS--806-922). The report basically summarizes scientific literature on the subject, concluding that normal individuals have insignificant levels of acetone on their breath. The data indicated, however, that dieters can have higher levels and that diabetics not in control of their blood-sugar had levels hundreds or even thousands of times higher than normal
a study confirming the effects of acetone in diabetics can be found in Mormann, Olsen, Sakshaug, and Morland, Measurement of Ethanol by Alkomat Breath Analyzer; Chemical Specificity and the Influence of Lung Function, Breath Technique and Environmental Temperature, 25 Blutalkohol 153 (1988). Diabetic subjects in that study also were found to have acetone levels sufficient to produce breath-alcohol readings of .06 percent.
Breath testing machines, such as the Intoxilyzer 5000, suffer from a little-known design defect: they do not actually measure alcohol! Rather, they use infrared beams of light which are absorbed by any chemical compound (including ethyl alcohol) in the breath which contains the "methyl group" in its molecular structure; the more absorption, the higher the blood-alcohol reading. The machine is programmed to assume that the compound is "probably" alcohol. Unfortunately, thousands of compounds containing the methyl group can register as alcohol. One of these is "acetone". And a well-documented by-product of hypoglycemia is a state called "ketoacidosis", which causes the production of acetones in the breath. In other words, the Breathalyzer will read significant levels of alcohol on a diabetic’s breath where there may be little or none. See, for example, Brick, "Diabetes, Breath Acetone and Breathalyzer Accuracy: A Case Study", 9(1) Alcohol, Drugs and Driving (1993).
Fact: roughly one in seven sober drivers on the road suffers from diabetes.
Showing posts with label Field Sobriety Test. Show all posts
Showing posts with label Field Sobriety Test. Show all posts
Saturday, March 24, 2007

Sunday, January 7, 2007
Statistical Evaluation of Standardized Field Sobriety Test
In Press: Journal of Forensic Sciences. May, 2005
Statistical Evaluation of Standardized Field Sobriety Tests
Michael P. Hlastala1, Ph.D.; Nayak L. Polissar2, Ph.D.; and Steven Oberman3, J.D.
1. Division of Pulmonary and Critical Care Medicine, Department of Medicine, Department of Physiology and Biophysics, University of Washington, Seattle, WA 98195-6522 2. The Mountain-Whisper-Light Statistical Consulting, Seattle, WA 98112 3. Daniel and Oberman, an Association of Trial Lawyers, 550 W. Main St., Suite 950; Knoxville, TN 37902 Running Head: Field Sobriety Test Accuracy
1
ABSTRACT: Standardized Field Sobriety Tests (SFSTs) are used as qualitative indicators of impairment by alcohol in individuals suspected of DUI. Stuster and Burns authored a report on this testing and presented the SFSTs as being 91% accurate in predicting Blood Alcohol Concentration (BAC) as lying at or above 0.08%. Their conclusions regarding accuracy are heavily weighted by the large number of subjects with very high BAC levels. This present study re-analyzes the original data with a more complete statistical evaluation. Our evaluation indicates that the accuracy of the SFSTs depends on the BAC level and is much poorer than that indicated by Stuster and Burns. While the SFSTs may be usable for evaluating suspects for BAC, the means of evaluation must be significantly modified to represent the large degree of variability of BAC in relation to SFST test scores. The tests are likely to be mainly useful in identifying subjects with a BAC substantially greater than 0.08%. Given the moderate to high correlation of the tests with BAC, there is potential for improved application of the test after further development, including a more diverse sample of BAC levels, adjustment of the scoring system and a statistically-based method for using the SFST to predict a BAC greater than 0.08 %.
KEYWORDS: forensic science, alcohol, intoxication, horizontal gaze nystagmus, one leg stand, walk and turn.
2
In August of 1998, The National Highway Traffic Safety Administration published on their web page, a final report entitled “Validation of the Standardized Field Sobriety Test Battery at BACs Below 0.10%” (1) as a follow-up to the original work of Burns and Moskowitz (2) and of that of Tharp et al (3). This report has been used as a standard for Field Sobriety Testing (FST) by law enforcement agencies around the US. In the report, authors Stuster and Burns conclude that the use of SFSTs for “estimates of the 0.08% level were accurate in 91 percent of the cases, or as high as 94 percent “if explanations for some of the false positives are accepted”. However the conclusion regarding accuracy is strongly influenced by the large number of subjects with BAC levels much greater than the 0.08% level The accuracy is substantially less for individuals with lower BAC levels, as will be shown below. Three additional papers have recently been published addressing accuracy of sobriety tests at lower alcohol levels. McKnight et al (4) evaluated BAC levels below 0.10 using Horizontal Gaze Nystagmus (HGN) and other modified tests. These authors used correlation analysis and concluded that HGN was the only valid indicator effective in identifying subjects between BAC levels of 0.04% and 0.08%. Another study by Heishman et al (5) focused on ethanol at low levels, cocaine and marijuana using correlation analysis with a variety of variables in addition to the SFSTs so it is difficult to correlate with the Stuster and Burns data. Cole and Nowaczyk (6) studied 21 sober (non-drinking) subjects using trained police officers to evaluate the SFSTs using videotapes of the individuals performing SFSTs. Forty-six percent of the officers’ decisions were that the individual had “too much to drink”.
3
SFSTs are usually used as tools by officers in the field to determine if an arrest followed by a breath test is justified. However, often breath test results are not available in court for a variety of reasons. Under these circumstances, the SFST’s are frequently used as an indication of impairment and sometimes as an indicator that the subject has a BAC greater than 0.08 g/dl.
The purpose of this report is to outline the statistical strengths and weaknesses of the Stuster and Burns report (1) (SBR) and to suggest some improvements in the use of SFSTs. Our findings suggest that the SFSTs may be helpful in estimating blood alcohol concentration (BAC) or breath alcohol concentration (BrAC), but the results of the SBR must be interpreted more conservatively than suggested by the authors.
Methods
The original study was funded by the National Highway Traffic Safety Administration (NHTSA) and carried out in the San Diego area by seven police officers who administered the SFSTs on those stopped for suspicion of driving under the influence (DUI) of alcohol. The officers were instructed to carry out the SFSTs on the subjects, and then to note an estimated BAC based only on the SFST results: including the walk and turn (WAT), the one leg stand (OLS) and the horizontal gaze nystagmus (HGN) tests. Subjects driving appropriately were not stopped or tested. However, “poor drivers” were included because they attracted the attention of the officers. The data
4
collection did not include body weight, presence of prior injuries, and other factors that might influence either the SFSTs or the measured BAC (7, 8).
The officers were asked to estimate the BAC values1 using SFSTs. Some of the subjects were arrested and given a breath test. The criteria used by the officers for estimation of BAC were not described in the report. There appears to be no specific quantitative combination of the FSTs, but rather there appears to be a subjective estimate of BAC. In other words, the decision to determine an estimated BAC was left to the subjective judgment of each officer. Each set of FSTs (for a given subject) was scored by only one officer. So it was not possible to assess inter-officer variability.
The data of Stuster and Burns were obtained via a request to the National Highway and Transportation Safety Administration (NHTSA) using the Freedom of Information Act (FOIA). Figure 1 shows the raw data {estimated BAC (EBAC) vs. measured BAC (MBAC)} for 297 subjects, who had a mean EBAC and MBAC of 0.117% and 0.122%, respectively. The figure shows the line of identity (EBAC = MBAC) and a least-squares regression line for EBAC vs. MBAC. In some cases the EBAC was greater than the MBAC resulting in a greater probability of arrest than if the MBAC had been used (points above the line of identity). In other cases EBAC was lower than MBAC resulting in a lower probability of arrest than if MBAC had been used
1 The SFSTs are designed to estimate the blood alcohol concentration (BAC) in units of gm/dl. However, the SFSTs are evaluated with the breath alcohol concentration (BrAC) in units of gm/210L. We will use the term, BAC and express the values with units of % to be consistent with the original study.
5
(points below the line of identity). EBAC is plotted against MBAC for all observations. The MBAC of these points varies over a range of BAC = 0.00% to 0.33%.
Statistical Methods
The accuracy with which officers classified drivers as having a BAC above or below 0.08% is presented graphically by sorting the data on increasing MBAC and then using a moving window of 21 observations, shifting upward one observation at a time. The accuracy is calculated as the percentage of observations in the window that are correctly classified as < 0.08% or = 0.08% MBAC. The accuracy for the group of 21 observations in the window is plotted vs. the mean of the MBAC measurements in the window.
Four traditional test evaluation statistics were also calculated, namely, 1) sensitivity (percent of true positives who are correctly classified as such by the test), 2) specificity (percent of true negatives who are correctly classified as such by the test), 3) positive predictive value (percent of those with a positive test result who are true positives), and 4) negative predictive value (percent of those with a negative test result who are true negatives) (9). These test evaluation statistics are more commonly used than the accuracy measure defined by SBR. However, the term “accuracy” is used in related literature and in legal proceedings, and, therefore, we use it in this article along with the four more traditional test statistics. It is important to note that one may have very high accuracy yet have much weaker performance on one or more of the four traditional statistics, as happened with SBR.
6
The relationship of MBAC with the three sub-tests of the SFST, with the total SFST score, and with EBAC were analyzed using simple and multivariate linear regression and with Pearson correlation coefficients as a descriptive measure. (10)
7
Results
The accuracy of the SFST is not a single percentage, but depends very much on the level of MBAC. Using the 21-observation moving window, the accuracy of classifying individuals as above or below 0.08% MBAC can be pictured in relation to measured breath alcohol concentration (Figure 2). The data show that the officer’s accuracy in estimating whether a person’s BAC is over or under 0.08% depends on the MBAC. If MBAC is lower than 0.04, the officer is generally 80% or more accurate at predicting a subject’s category (above or below 0.08% MBAC) in the sample studied. If the MBAC is greater than 0.09%, then the officer is about 90% or more accurate at predicting the subject’s category. However, if the MBAC is around 0.08%, specifically, between 0.06 and 0.08, the SFSTs are only about 30-60% accurate in correctly predicting whether a subject’s MBAC is = 0.08% or < 0.08%. The minimum accuracy in Figure 2 is 33%.
The data also provide evidence that the officers’ estimates were not based only on the SFST. This is shown by an analysis where even very liberal use of only the SFST in a predictive model yields a BAC estimate with precision that is substantially inferior to the precision of the officers’ estimates, even though the officers were instructed to base their estimates only on the SFST.
Specifically, regression models provide a method to estimate MBAC based only on the three tests in the SFST. A regression model was fitted to predict MBAC from
8
independent variables including linear and quadratic (squared) terms in the three tests: HGN, HGN2, OLS, OLS2, WAT, and WAT2. The model is liberal in using the three tests, because not all of the variables add significantly or substantially to prediction of the MBAC. Nevertheless, all variables were retained (yielding an over-fitted model), in order to maximize use of the tests within this sample, attempting to mimic or even improve on how an officer might combine test results in practice. Interaction terms between tests were also tried (e.g., HGN*WAT), but they added so little to prediction of MBAC, with a negligible increase in R-squared, that they were not used in the liberal model. (A more appropriate regression model is presented later.)
The amount of variation in MBAC explained by the model based on the three tests alone (and their quadratic terms) is 56%, which increases to 76% when EBAC (the officer estimate of BAC) is added to the model, in addition to the tests. The gain in precision in predicting the quantitative value of MBAC from the model based only on tests to the model based on the tests plus the officer estimates is statistically very significant (20% increase in R-squared, p < 0.001). The mean absolute difference between the officer estimate, EBAC, and the measured value, MBAC, is 0.024% (in BAC units), versus a larger value of 0.031% indicating less precision, for the mean absolute difference between the model-based estimate and the MBAC.
The striking increase in precision when the officer estimates are added to a liberally-fitted model using only the tests suggests that the officers did not base their estimate solely on the test scores but most likely used other clues. This suggests that
9
it may be impractical to evaluate the three tests in isolation from other non-test clues used by the officers, such as slurred speech, odor of alcohol, appearance, admitted drinking or driving behavior. Another explanation may be the presence of other drugs in addition to alcohol. Or, as suggested by critics of the study, Price and Cole (9), it may be that the officers used portable breath testers (PBT) prior to recording their BrAC estimate and were then influenced by the known PBT values. The Stuster and Burns report (1, page 10) notes that “all police officers participating in the study were equipped with NHTSA-approved, portable breath testing devices to assess the BACs of all drivers who were administered the SFST...”.
The utility of individual tests (HGN, OLS and WAT) and the combination of tests to predict MBAC can be evaluated by plotting MBAC against the total score from the individual tests. Figure 3 shows a plot of the measured breath alcohol concentration versus the total score from the three tests, with a reference line at MBAC = 0.08%. For Figure 2 only, a small amount of “jitter” (random noise) has been added to the score of each subject to avoid overlapping points. The jitter is less than ±0.25 points horizontally. The considerable variation in MBAC above each point score is apparent, and in addition, for total scores 4-18, there are MBAC values lying on both sides of the 0.08% cut-point. In order to be 95% confident that the subject has a MBAC greater than 0.08%, the total score (HGN + OLS + WAT) must exceed approximately 17 (based on the 95% lower confidence limit for predicted MBAC for an individual from the regression of MBAC on total score).
10
Figure 4 shows the percentage of measured breath alcohol concentration values that are above 0.08% in relation to each of the three individual test scores. For each score (horizontal axis), the percent of subjects with that score or higher who have an MBAC larger than 0.08% is plotted (Y-axis). In order to observe 95% of persons with MBAC > 0.08% in this sample, the score for WAT (circles in the plot) must be 5 or larger. None of the scores for HGN (crosses) reach the 95% point and the scores for OLS (triangles) reach over the 95% point only at 10 points and higher, where there are only two subjects. Note that the “failure” scores for these three tests, as specified by Stuster and Burns, are 4 for HGN, 2 for OLS, and 2 for WAT (12). Failure of an FST according to NHTSA standards simply estimate the 50% likelihood that a subject is > 0.08%. The data show that in order to be considerably more confident that the subject is above 0.08%, the scores should be much higher than the “failure” scores.
The correlation coefficients for individual tests vs. both MBAC and EBAC are shown in Table 1. The FST with the strongest correlation with MBAC is HGN followed by WAT and OLS. The strongest correlation is with the total test (determined by summing the scores for the three FSTs. However, total score and HGN have very similar correlations with MBAC and EBAC.
11
Discussion
Figure 5, redrawn from Figure 4 of SBR. illustrates the logic used by Stuster and Burns to describe the accuracy of SFST. A correct decision was registered if both MBAC and EBAC are = 0.08% (upper, right quadrant; N=210) or both are "0.08% (lower, left quadrant; N=59). An incorrect decision occurred with a false positive (upper, left quadrant; N=24), when (EBAC = 0.08% and MBAC < n="4)," mbac =" 0.08%." n =" 214"> 0.12, Stuster and Burn’s conclusion that the tests have 91% accuracy was strongly affected by the fact that a majority of points are in this high MBAC range, where correct classification as above
0.08 is more reliable. Of the correct results, 210 data points out of a study total of 297 were in the 0.08% to 0.33% range and 59 were in the 0.000% to 0.079% range. (The accuracy estimated by Stuster and Burns as 91% was calculated from the values in Figure 2 as (210 + 59)/297 = 0.91). The number of false positives (N=24) was much greater than the number of the false negatives (N=4). In the range of data near the 0.08% level, the estimated BAC by these experienced officers overestimates the measured BAC, introducing a bias against the subjects (see Figure 1). Using EBAC to determine whether the subject MBAC is greater than 0.08% is 100% accurate for all subjects with MBAC > 0.12%. In other words, if the subject is highly intoxicated, the SFST provide an accurate indication. It is not surprising that if the subject is clearly intoxicated, the officers can make this determination. If the MBAC is < 0.08%, there is a 24 / (24 +59) = 29% chance of a false arrest (determined from Figure 2). 12
To illustrate the problem with the SBR statistical strategy, let’s apply the same logic to determine the level of accuracy at hypothetical cut-point (“legal limit”) levels lower than 0.08%. For example, if Stuster and Burns were to use the same data set to examine the accuracy at lower threshold BAC (0.07% down to 0.01%) levels, they would determine an increasing accuracy level at lower threshold levels. The relative increase in apparent accuracy with decreasing BAC threshold is shown in Table 2, which indicates a hypothetical cut-point for designating a driver as “over the limit”. For example, if the legal limit were 0.04%, the SBR method would conclude that SFST are 93.9% accurate. At a legal limit of 0.01%, the SBR conclusion would be that the SFST are 99.3% accurate. The method used by Stuster and Burns has determined a high degree of accuracy simply because most of the data points are at MBACs much greater than the cut-point of 0.08% used in their study. What underlies this problem is the weakness of “accuracy” as the sole performance statistic for this test, as well as the specific nature of this sample, weighted heavily toward individuals with high levels of MBAC.
An alternative way to explore the accuracy of SFST is to assess the accuracy over a range of points that is symmetric about the 0.08% cut-point (limit). In addition to accuracy, four traditional statistics of test performance also help in this exploration: sensitivity, specificity, positive predictive value and negative predictive value. Table 3 shows the accuracy of SFST when the range of interest extends above and below 0.08% by the same amount, along with the four traditional performance statistics. For
13
data with MBAC ranging between 0.07% and 0.09%, The SFST are 72.2% accurate. As the range broadens, the calculated apparent accuracy increases. At the broadest range of 0.04% – 0.12%, the calculated apparent accuracy is now 82.2%. Taken to the extreme, using all of the data points (MBAC = 0.00% to 0.033%), the apparent accuracy is 91% as calculated by Stuster and Burns. The accuracy of SFST in the vicinity of 0.08% is poorer than estimated in the SBR for the whole data set.
Parallel with the reduced level of accuracy in the range 0.07-0.09% MBAC, the four traditional test performance statistics in Table 3 also show varying performance in this range. Specificity is low (36%), indicating that a large fraction of subjects (64%) would be falsely declared over the limit. The sensitivity is excellent in this range, 96%, due to the tendency of EBAC to overestimate alcohol level compared to MBAC. Positive predictive value (PPV) is fair, 70%, indicating that 30% of the subjects declared over-limit would not be so. Negative predictive value (NPV) is good, 83%, indicating that most of those declared under-limit would really be so, but this, again, due to the over-estimation by EBAC. As the range of MBAC in Table 3 steadily widens to finally include all cases, specificity increases to a maximum of only 71%, while sensitivity, PPV and NPV all reach at least 90%, due to predominance in this sample of high levels of measured alcohol.
A closer examination of the data between 0.04% and 0.12% is shown on Figure 6 (by expanding a section of Figure 1). Another way of determining the officer’s accuracy in estimating the BAC is to compare the fraction of observations (EBAC)
14
overestimating and underestimating the MBAC. If we consider three ranges of MBAC, 0.00% = MBAC <> 0.10%, 50 are overestimates and 108 are underestimates of MBAC. Thus, the experienced officers used in this study tended to overestimate the BAC at low levels (<> 0.10).
The optimal predictive capability of the SFST depends on the scaling for the particular test and the predictive capacity of the test. The maximum scores permitted for HGN, OLS and WAT are 6, 4, and 8, respectively. However, some officers assigned scores that were greater than the maximum score allowable for a given FST. The highest scores assigned in this study were 6, 12, and 9 for the HGN, OLS and WAT, respectively.
By adjusting the weight given to each test and taking account of the precision of the test in predicting MBAC, we find the following linear regression model (equation 1)
15
maximizes the precision of the SFST for estimating MBAC, using only linear versions of the three test variables. The quadratic terms (squared values of the three test variables), while statistically significant as a group (p = 0.004) increase R-squared by only 2%, from 54% to 56%, and have been omitted for parsimony. The model is based on the 261 cases without any missing values for the three tests. Note in the equation below that the increase in BAC per point increase in the score is largest for HGN, with a 0.017 increase in BAC, on the average, for each point increase in the HGN score.
MBAC = -0.007 + 0.017 x (HGN Score) + 0.0012 x (OLS Score) + 0.011 x (WAT Score) (Eq. 1)
The equation does quite well in predicting the mean MBAC, but there is still a large spread of individuals around the predicted value. The standard deviation of individual MBAC values around the predicted regression value is 0.044%. A 95% confidence interval for the true MBAC of an individual, predicted from this regression model, would have a minimum width of ± 0.09%, certainly a wide range.
Using the predictors (HGN, OLS, WAT), the additive model from equation 1 accounted for 54% of the variability in MBAC (corresponding to a correlation of 0.73). Including EBAC as an additional predictor in the model resulted in a substantial and significant increase (p < 0.001) in the variance of MBAC explained, increasing it to 75%. As noted earlier, this marked increase in predictability of MBAC by adding in the
16
officer’s EBAC indicates that the officers’ estimates were probably influenced by factors other than the three FSTs
We believe that the accuracy of the SFST can be improved if a weighted sum of scores from the three standard tests is combined as described in Equation 1. However, this relationship should be tested in a variety of populations, and, in a larger sample, it is possible that non-linear and other functions of the test scores may help in prediction. The evaluation should include an assessment of accuracy and bias in estimating the numerical BAC and, as well, the accuracy in classifying individuals above or below specified limits (such as 0.08%) for various low, medium and high levels of measured BAC. In follow-up trials of the FST, the instructions given to officers for converting test scores into estimates of BAC should be stated more explicitly (such as using equation 1 above, or another algorithm). Further, some attempt should be made to identify and incorporate (or control) other factors, aside from the SFST scores, that influence BAC estimates. It may be difficult or impossible to “turn off” other cues that officers use in estimating BAC or in making a decision about an arrest.
The magnitude of the correlations between the tests and MBAC suggests that this type of testing could be developed further, either through re-formulation of the tests, or through different scoring systems, or by other means. In the current framework, the test scores have to be quite high to provide confidence that the subject is above 0.08%, but further development could potentially improve confidence in the three test results, both singly and in combination. And, anticipating the possibility that
17
some jurisdictions may now or in the future have lower (or higher) legal limits than 0.08%, testing could include more representation from lower levels of BrAC.
The SFST total score and sub-test scores are undoubtedly correlated with breath alcohol level (Table 1). However, predicting a numeric blood alcohol concentration from the SFST scores, as the SFST methodology is defined in the Stuster and Burns report, has limited accuracy and precision. The evidence for this is a) considerable over- and under-estimation of MBAC (see Results section); b) a large range of observed MBAC values corresponding to any given total SFST score (Figure 3); and, c) a large spread of observed MBAC values around predicted MBAC values from a liberal regression model that attempts to optimize the use of the SFST, yet has a minimum prediction uncertainty of ±0.09%.
If our interest is not in quantitative prediction, but in classifying individuals, such as below vs. equal to or above a limit of 0.08%, the utility of the SFST depends very much on how intoxicated an individual is. Accuracy (and specificity) are low when individuals are close to 0.08% MBAC (Figure 2 and Table 3), but if the individuals are quite intoxicated, such as above 0.12%, then accuracy is high (Figure 2).
The use of a single test performance statistic, accuracy, and the calculation of this one statistic for the entire study sample is an over-simplification of the more complex relationship between the SFST score and the MBAC level.
18
SFSTs could become more useful if much more data are accumulated and analyzed using statistical methods such as those presented in this paper, including some of the traditional test evaluation statistics. It is likely that the usefulness of SFSTs will be greatest for drivers who have high test scores. The moderate to strong correlations between the tests and MBAC suggest a potential for further test development. Enhanced understanding would come from tests applied to a more diverse population sample as well as from the development of a statistical approach to predicting the probability of a subject having a BAC greater than 0.08 % from a particular set of SFST scores.
19
References:
1. Stuster J, Burns M. Validation of the standardized field sobriety test battery at BACs below 0.10 percent. August, 1998. National Highway Traffic Safety Administration. 2. Burns M, Moskowitz H. Psychophysical tests for DWI arrest. Technical Report DOTHS-5-01242. National Highway Traffic Safety Administration. Washington, DC. 3. Tharp V, Burns M and Moskowitz H. Development and field test of psychophysical tests for DWI arrest. US Department of Transportation, National Highway Traffic Safety Administration Final Report DOT-HS-805-864, Washington, DC. 4. McKnight, AJ, Langston, EA, McKnight AS, Lange, JE. Sobriety tests for low blood alcohol concentrations. Acc Anal & Prevent 2002;34: 305-311. 5. Heishman, SJ, Singleton, EG, Crouch, DJ. Laboratory validation study of drug evaluation and classification program: ethanol, cocaine, and marijuana. J Anal Toxicol 1996; 20: 468-481. 6. Cole S and Nowaczyk, RH. Field sobriety tests: Are they designed for failure? Perceptual and Motor Skills 1994; 79: 99-104. 7. Hlastala M. The alcohol breath test - A brief review. J Appl Physiol 1998; 84: 401408. 8. Hlastala M. Invited editorial on "The alcohol breath test". J Appl Physiol 2002; 93: 405-406. 9. Price P, Cole S. NHTSA field sobriety tests validation v. invalidation, 25 The Champion. 2001; 25: 37-42. 10.Fisher LD, van Belle G. Biostatistics. Wiley, 1993. 11.Weisberg S. Applied linear regression, 2nd edition. Wiley, 1985. 12.NHTSA DWI Detection and Standardized Field Sobriety Testing Student Manual, DOT-HS-178-R1/02.
20
Additional information and reprint requests:
Michael P. Hlastala, Ph.D. Division of Pulmonary and Critical Care Medicine, Department of Medicine Department of Physiology and Biophysics Box 356522 University of Washington Seattle, WA 98195-6522 Email: hlastala@u.washington.edu
21
TABLES
Table 1. Pearson correlation of three Field Sobriety Tests with measured breath alcohol (MBAC) and officer-estimated breath alcohol (EBAC).
TEST MBAC EBAC TOTAL score (3 tests) 0.69 0.74 HGN Horizontal Gaze Nystagmus 0.65 0.71 WAT Walk and turn 0.61 0.64 OLS One leg stand 0.45 0.51
22
Table 2. Accuracy of "over-limit" designation based on estimated breath alcohol concentration for defined cut-points (hypothetical legal "limit") of measured breath alcohol concentration (MBAC)
Legal “limit” (%) N: All N: MBAC < cut-point N: MBAC ! cut-point Accuracy* 0.10 297 107 190 90.6% 0.09 297 97 200 89.2% 0.08 297 83 214 90.6% 0.07 297 69 228 89.6% 0.06 297 58 239 90.6% 0.05 297 43 254 92.3% 0.04 297 29 268 93.9% 0.03 297 19 278 93.9% 0.02 297 9 288 97.6% 0.01 297 4 293 99.3%
*Accuracy = 100%*(# correctly classified as ! limit or < limit)/total
23
Table 3. Accuracy and other statistics related to “over-limit” designation based on estimated breath alcohol concentration for defined ranges of MBAC.
Range of MBAC Total in Range Accuracy Sensitivity Specificity PPV NPV 0.07 – 0.09 36 72% 96% 36% 70% 83% 0.06 – 0.10 65 75% 95% 44% 73% 85% 0.05 – 0.11 97 79% 97% 55% 75% 92% 0.04 – 0.12 135 82% 95% 63% 79% 90% All cases 297 91% 98% 71% 90% 94%
Accuracy = (# correctly classified as ! 0.08 or < 0.08)/total PPV = positive predictive value NPV = negative predictive value
24
Figure Legends:
Figure 1. Estimated BAC vs. Measured BAC for all subjects in the Stuster and Burns study. The line of identity (Estimated BAC = Measured BAC; thin line) and linear regression line (heavy solid line) are shown.
Figure 2. Accuracy of classification of individuals as ! 0.08% or < 0.08% MBAC using the officer estimate. Accuracy is plotted vs. measured breath alcohol concentration (horizontal axis).
Figure 3. Measured breath alcohol concentration versus total of three test scores.
Figure 4. Percent of subjects with MBAC greater than 0.08% vs. the individual test score, with the percentage calculated for all individuals at or above the designated score.
Figure 5. Decision matrix at 0.08% BAC (modified from figure 4 in Stuster and Burns).
Figure 6. Data from Figure 1 expanded to show points between 0.04% and 0.12%. The line of identity (EBAC = MBAC), dashed line and linear regression line (heavy solid line) are shown.
25
Figure 1
26
Figure 2
27
Figure 3.
28
Figure 4.
29
30 Figure 5. Measured BAC (MBAC) Estimated BAC (EBAC) < 0.08% ! 0.08% < 0.08% ! 0.08% N=24 N=210 N=59 N=4 Figure 6.
31
Statistical Evaluation of Standardized Field Sobriety Tests
Michael P. Hlastala1, Ph.D.; Nayak L. Polissar2, Ph.D.; and Steven Oberman3, J.D.
1. Division of Pulmonary and Critical Care Medicine, Department of Medicine, Department of Physiology and Biophysics, University of Washington, Seattle, WA 98195-6522 2. The Mountain-Whisper-Light Statistical Consulting, Seattle, WA 98112 3. Daniel and Oberman, an Association of Trial Lawyers, 550 W. Main St., Suite 950; Knoxville, TN 37902 Running Head: Field Sobriety Test Accuracy
1
ABSTRACT: Standardized Field Sobriety Tests (SFSTs) are used as qualitative indicators of impairment by alcohol in individuals suspected of DUI. Stuster and Burns authored a report on this testing and presented the SFSTs as being 91% accurate in predicting Blood Alcohol Concentration (BAC) as lying at or above 0.08%. Their conclusions regarding accuracy are heavily weighted by the large number of subjects with very high BAC levels. This present study re-analyzes the original data with a more complete statistical evaluation. Our evaluation indicates that the accuracy of the SFSTs depends on the BAC level and is much poorer than that indicated by Stuster and Burns. While the SFSTs may be usable for evaluating suspects for BAC, the means of evaluation must be significantly modified to represent the large degree of variability of BAC in relation to SFST test scores. The tests are likely to be mainly useful in identifying subjects with a BAC substantially greater than 0.08%. Given the moderate to high correlation of the tests with BAC, there is potential for improved application of the test after further development, including a more diverse sample of BAC levels, adjustment of the scoring system and a statistically-based method for using the SFST to predict a BAC greater than 0.08 %.
KEYWORDS: forensic science, alcohol, intoxication, horizontal gaze nystagmus, one leg stand, walk and turn.
2
In August of 1998, The National Highway Traffic Safety Administration published on their web page, a final report entitled “Validation of the Standardized Field Sobriety Test Battery at BACs Below 0.10%” (1) as a follow-up to the original work of Burns and Moskowitz (2) and of that of Tharp et al (3). This report has been used as a standard for Field Sobriety Testing (FST) by law enforcement agencies around the US. In the report, authors Stuster and Burns conclude that the use of SFSTs for “estimates of the 0.08% level were accurate in 91 percent of the cases, or as high as 94 percent “if explanations for some of the false positives are accepted”. However the conclusion regarding accuracy is strongly influenced by the large number of subjects with BAC levels much greater than the 0.08% level The accuracy is substantially less for individuals with lower BAC levels, as will be shown below. Three additional papers have recently been published addressing accuracy of sobriety tests at lower alcohol levels. McKnight et al (4) evaluated BAC levels below 0.10 using Horizontal Gaze Nystagmus (HGN) and other modified tests. These authors used correlation analysis and concluded that HGN was the only valid indicator effective in identifying subjects between BAC levels of 0.04% and 0.08%. Another study by Heishman et al (5) focused on ethanol at low levels, cocaine and marijuana using correlation analysis with a variety of variables in addition to the SFSTs so it is difficult to correlate with the Stuster and Burns data. Cole and Nowaczyk (6) studied 21 sober (non-drinking) subjects using trained police officers to evaluate the SFSTs using videotapes of the individuals performing SFSTs. Forty-six percent of the officers’ decisions were that the individual had “too much to drink”.
3
SFSTs are usually used as tools by officers in the field to determine if an arrest followed by a breath test is justified. However, often breath test results are not available in court for a variety of reasons. Under these circumstances, the SFST’s are frequently used as an indication of impairment and sometimes as an indicator that the subject has a BAC greater than 0.08 g/dl.
The purpose of this report is to outline the statistical strengths and weaknesses of the Stuster and Burns report (1) (SBR) and to suggest some improvements in the use of SFSTs. Our findings suggest that the SFSTs may be helpful in estimating blood alcohol concentration (BAC) or breath alcohol concentration (BrAC), but the results of the SBR must be interpreted more conservatively than suggested by the authors.
Methods
The original study was funded by the National Highway Traffic Safety Administration (NHTSA) and carried out in the San Diego area by seven police officers who administered the SFSTs on those stopped for suspicion of driving under the influence (DUI) of alcohol. The officers were instructed to carry out the SFSTs on the subjects, and then to note an estimated BAC based only on the SFST results: including the walk and turn (WAT), the one leg stand (OLS) and the horizontal gaze nystagmus (HGN) tests. Subjects driving appropriately were not stopped or tested. However, “poor drivers” were included because they attracted the attention of the officers. The data
4
collection did not include body weight, presence of prior injuries, and other factors that might influence either the SFSTs or the measured BAC (7, 8).
The officers were asked to estimate the BAC values1 using SFSTs. Some of the subjects were arrested and given a breath test. The criteria used by the officers for estimation of BAC were not described in the report. There appears to be no specific quantitative combination of the FSTs, but rather there appears to be a subjective estimate of BAC. In other words, the decision to determine an estimated BAC was left to the subjective judgment of each officer. Each set of FSTs (for a given subject) was scored by only one officer. So it was not possible to assess inter-officer variability.
The data of Stuster and Burns were obtained via a request to the National Highway and Transportation Safety Administration (NHTSA) using the Freedom of Information Act (FOIA). Figure 1 shows the raw data {estimated BAC (EBAC) vs. measured BAC (MBAC)} for 297 subjects, who had a mean EBAC and MBAC of 0.117% and 0.122%, respectively. The figure shows the line of identity (EBAC = MBAC) and a least-squares regression line for EBAC vs. MBAC. In some cases the EBAC was greater than the MBAC resulting in a greater probability of arrest than if the MBAC had been used (points above the line of identity). In other cases EBAC was lower than MBAC resulting in a lower probability of arrest than if MBAC had been used
1 The SFSTs are designed to estimate the blood alcohol concentration (BAC) in units of gm/dl. However, the SFSTs are evaluated with the breath alcohol concentration (BrAC) in units of gm/210L. We will use the term, BAC and express the values with units of % to be consistent with the original study.
5
(points below the line of identity). EBAC is plotted against MBAC for all observations. The MBAC of these points varies over a range of BAC = 0.00% to 0.33%.
Statistical Methods
The accuracy with which officers classified drivers as having a BAC above or below 0.08% is presented graphically by sorting the data on increasing MBAC and then using a moving window of 21 observations, shifting upward one observation at a time. The accuracy is calculated as the percentage of observations in the window that are correctly classified as < 0.08% or = 0.08% MBAC. The accuracy for the group of 21 observations in the window is plotted vs. the mean of the MBAC measurements in the window.
Four traditional test evaluation statistics were also calculated, namely, 1) sensitivity (percent of true positives who are correctly classified as such by the test), 2) specificity (percent of true negatives who are correctly classified as such by the test), 3) positive predictive value (percent of those with a positive test result who are true positives), and 4) negative predictive value (percent of those with a negative test result who are true negatives) (9). These test evaluation statistics are more commonly used than the accuracy measure defined by SBR. However, the term “accuracy” is used in related literature and in legal proceedings, and, therefore, we use it in this article along with the four more traditional test statistics. It is important to note that one may have very high accuracy yet have much weaker performance on one or more of the four traditional statistics, as happened with SBR.
6
The relationship of MBAC with the three sub-tests of the SFST, with the total SFST score, and with EBAC were analyzed using simple and multivariate linear regression and with Pearson correlation coefficients as a descriptive measure. (10)
7
Results
The accuracy of the SFST is not a single percentage, but depends very much on the level of MBAC. Using the 21-observation moving window, the accuracy of classifying individuals as above or below 0.08% MBAC can be pictured in relation to measured breath alcohol concentration (Figure 2). The data show that the officer’s accuracy in estimating whether a person’s BAC is over or under 0.08% depends on the MBAC. If MBAC is lower than 0.04, the officer is generally 80% or more accurate at predicting a subject’s category (above or below 0.08% MBAC) in the sample studied. If the MBAC is greater than 0.09%, then the officer is about 90% or more accurate at predicting the subject’s category. However, if the MBAC is around 0.08%, specifically, between 0.06 and 0.08, the SFSTs are only about 30-60% accurate in correctly predicting whether a subject’s MBAC is = 0.08% or < 0.08%. The minimum accuracy in Figure 2 is 33%.
The data also provide evidence that the officers’ estimates were not based only on the SFST. This is shown by an analysis where even very liberal use of only the SFST in a predictive model yields a BAC estimate with precision that is substantially inferior to the precision of the officers’ estimates, even though the officers were instructed to base their estimates only on the SFST.
Specifically, regression models provide a method to estimate MBAC based only on the three tests in the SFST. A regression model was fitted to predict MBAC from
8
independent variables including linear and quadratic (squared) terms in the three tests: HGN, HGN2, OLS, OLS2, WAT, and WAT2. The model is liberal in using the three tests, because not all of the variables add significantly or substantially to prediction of the MBAC. Nevertheless, all variables were retained (yielding an over-fitted model), in order to maximize use of the tests within this sample, attempting to mimic or even improve on how an officer might combine test results in practice. Interaction terms between tests were also tried (e.g., HGN*WAT), but they added so little to prediction of MBAC, with a negligible increase in R-squared, that they were not used in the liberal model. (A more appropriate regression model is presented later.)
The amount of variation in MBAC explained by the model based on the three tests alone (and their quadratic terms) is 56%, which increases to 76% when EBAC (the officer estimate of BAC) is added to the model, in addition to the tests. The gain in precision in predicting the quantitative value of MBAC from the model based only on tests to the model based on the tests plus the officer estimates is statistically very significant (20% increase in R-squared, p < 0.001). The mean absolute difference between the officer estimate, EBAC, and the measured value, MBAC, is 0.024% (in BAC units), versus a larger value of 0.031% indicating less precision, for the mean absolute difference between the model-based estimate and the MBAC.
The striking increase in precision when the officer estimates are added to a liberally-fitted model using only the tests suggests that the officers did not base their estimate solely on the test scores but most likely used other clues. This suggests that
9
it may be impractical to evaluate the three tests in isolation from other non-test clues used by the officers, such as slurred speech, odor of alcohol, appearance, admitted drinking or driving behavior. Another explanation may be the presence of other drugs in addition to alcohol. Or, as suggested by critics of the study, Price and Cole (9), it may be that the officers used portable breath testers (PBT) prior to recording their BrAC estimate and were then influenced by the known PBT values. The Stuster and Burns report (1, page 10) notes that “all police officers participating in the study were equipped with NHTSA-approved, portable breath testing devices to assess the BACs of all drivers who were administered the SFST...”.
The utility of individual tests (HGN, OLS and WAT) and the combination of tests to predict MBAC can be evaluated by plotting MBAC against the total score from the individual tests. Figure 3 shows a plot of the measured breath alcohol concentration versus the total score from the three tests, with a reference line at MBAC = 0.08%. For Figure 2 only, a small amount of “jitter” (random noise) has been added to the score of each subject to avoid overlapping points. The jitter is less than ±0.25 points horizontally. The considerable variation in MBAC above each point score is apparent, and in addition, for total scores 4-18, there are MBAC values lying on both sides of the 0.08% cut-point. In order to be 95% confident that the subject has a MBAC greater than 0.08%, the total score (HGN + OLS + WAT) must exceed approximately 17 (based on the 95% lower confidence limit for predicted MBAC for an individual from the regression of MBAC on total score).
10
Figure 4 shows the percentage of measured breath alcohol concentration values that are above 0.08% in relation to each of the three individual test scores. For each score (horizontal axis), the percent of subjects with that score or higher who have an MBAC larger than 0.08% is plotted (Y-axis). In order to observe 95% of persons with MBAC > 0.08% in this sample, the score for WAT (circles in the plot) must be 5 or larger. None of the scores for HGN (crosses) reach the 95% point and the scores for OLS (triangles) reach over the 95% point only at 10 points and higher, where there are only two subjects. Note that the “failure” scores for these three tests, as specified by Stuster and Burns, are 4 for HGN, 2 for OLS, and 2 for WAT (12). Failure of an FST according to NHTSA standards simply estimate the 50% likelihood that a subject is > 0.08%. The data show that in order to be considerably more confident that the subject is above 0.08%, the scores should be much higher than the “failure” scores.
The correlation coefficients for individual tests vs. both MBAC and EBAC are shown in Table 1. The FST with the strongest correlation with MBAC is HGN followed by WAT and OLS. The strongest correlation is with the total test (determined by summing the scores for the three FSTs. However, total score and HGN have very similar correlations with MBAC and EBAC.
11
Discussion
Figure 5, redrawn from Figure 4 of SBR. illustrates the logic used by Stuster and Burns to describe the accuracy of SFST. A correct decision was registered if both MBAC and EBAC are = 0.08% (upper, right quadrant; N=210) or both are "0.08% (lower, left quadrant; N=59). An incorrect decision occurred with a false positive (upper, left quadrant; N=24), when (EBAC = 0.08% and MBAC < n="4)," mbac =" 0.08%." n =" 214"> 0.12, Stuster and Burn’s conclusion that the tests have 91% accuracy was strongly affected by the fact that a majority of points are in this high MBAC range, where correct classification as above
0.08 is more reliable. Of the correct results, 210 data points out of a study total of 297 were in the 0.08% to 0.33% range and 59 were in the 0.000% to 0.079% range. (The accuracy estimated by Stuster and Burns as 91% was calculated from the values in Figure 2 as (210 + 59)/297 = 0.91). The number of false positives (N=24) was much greater than the number of the false negatives (N=4). In the range of data near the 0.08% level, the estimated BAC by these experienced officers overestimates the measured BAC, introducing a bias against the subjects (see Figure 1). Using EBAC to determine whether the subject MBAC is greater than 0.08% is 100% accurate for all subjects with MBAC > 0.12%. In other words, if the subject is highly intoxicated, the SFST provide an accurate indication. It is not surprising that if the subject is clearly intoxicated, the officers can make this determination. If the MBAC is < 0.08%, there is a 24 / (24 +59) = 29% chance of a false arrest (determined from Figure 2). 12
To illustrate the problem with the SBR statistical strategy, let’s apply the same logic to determine the level of accuracy at hypothetical cut-point (“legal limit”) levels lower than 0.08%. For example, if Stuster and Burns were to use the same data set to examine the accuracy at lower threshold BAC (0.07% down to 0.01%) levels, they would determine an increasing accuracy level at lower threshold levels. The relative increase in apparent accuracy with decreasing BAC threshold is shown in Table 2, which indicates a hypothetical cut-point for designating a driver as “over the limit”. For example, if the legal limit were 0.04%, the SBR method would conclude that SFST are 93.9% accurate. At a legal limit of 0.01%, the SBR conclusion would be that the SFST are 99.3% accurate. The method used by Stuster and Burns has determined a high degree of accuracy simply because most of the data points are at MBACs much greater than the cut-point of 0.08% used in their study. What underlies this problem is the weakness of “accuracy” as the sole performance statistic for this test, as well as the specific nature of this sample, weighted heavily toward individuals with high levels of MBAC.
An alternative way to explore the accuracy of SFST is to assess the accuracy over a range of points that is symmetric about the 0.08% cut-point (limit). In addition to accuracy, four traditional statistics of test performance also help in this exploration: sensitivity, specificity, positive predictive value and negative predictive value. Table 3 shows the accuracy of SFST when the range of interest extends above and below 0.08% by the same amount, along with the four traditional performance statistics. For
13
data with MBAC ranging between 0.07% and 0.09%, The SFST are 72.2% accurate. As the range broadens, the calculated apparent accuracy increases. At the broadest range of 0.04% – 0.12%, the calculated apparent accuracy is now 82.2%. Taken to the extreme, using all of the data points (MBAC = 0.00% to 0.033%), the apparent accuracy is 91% as calculated by Stuster and Burns. The accuracy of SFST in the vicinity of 0.08% is poorer than estimated in the SBR for the whole data set.
Parallel with the reduced level of accuracy in the range 0.07-0.09% MBAC, the four traditional test performance statistics in Table 3 also show varying performance in this range. Specificity is low (36%), indicating that a large fraction of subjects (64%) would be falsely declared over the limit. The sensitivity is excellent in this range, 96%, due to the tendency of EBAC to overestimate alcohol level compared to MBAC. Positive predictive value (PPV) is fair, 70%, indicating that 30% of the subjects declared over-limit would not be so. Negative predictive value (NPV) is good, 83%, indicating that most of those declared under-limit would really be so, but this, again, due to the over-estimation by EBAC. As the range of MBAC in Table 3 steadily widens to finally include all cases, specificity increases to a maximum of only 71%, while sensitivity, PPV and NPV all reach at least 90%, due to predominance in this sample of high levels of measured alcohol.
A closer examination of the data between 0.04% and 0.12% is shown on Figure 6 (by expanding a section of Figure 1). Another way of determining the officer’s accuracy in estimating the BAC is to compare the fraction of observations (EBAC)
14
overestimating and underestimating the MBAC. If we consider three ranges of MBAC, 0.00% = MBAC <> 0.10%, 50 are overestimates and 108 are underestimates of MBAC. Thus, the experienced officers used in this study tended to overestimate the BAC at low levels (<> 0.10).
The optimal predictive capability of the SFST depends on the scaling for the particular test and the predictive capacity of the test. The maximum scores permitted for HGN, OLS and WAT are 6, 4, and 8, respectively. However, some officers assigned scores that were greater than the maximum score allowable for a given FST. The highest scores assigned in this study were 6, 12, and 9 for the HGN, OLS and WAT, respectively.
By adjusting the weight given to each test and taking account of the precision of the test in predicting MBAC, we find the following linear regression model (equation 1)
15
maximizes the precision of the SFST for estimating MBAC, using only linear versions of the three test variables. The quadratic terms (squared values of the three test variables), while statistically significant as a group (p = 0.004) increase R-squared by only 2%, from 54% to 56%, and have been omitted for parsimony. The model is based on the 261 cases without any missing values for the three tests. Note in the equation below that the increase in BAC per point increase in the score is largest for HGN, with a 0.017 increase in BAC, on the average, for each point increase in the HGN score.
MBAC = -0.007 + 0.017 x (HGN Score) + 0.0012 x (OLS Score) + 0.011 x (WAT Score) (Eq. 1)
The equation does quite well in predicting the mean MBAC, but there is still a large spread of individuals around the predicted value. The standard deviation of individual MBAC values around the predicted regression value is 0.044%. A 95% confidence interval for the true MBAC of an individual, predicted from this regression model, would have a minimum width of ± 0.09%, certainly a wide range.
Using the predictors (HGN, OLS, WAT), the additive model from equation 1 accounted for 54% of the variability in MBAC (corresponding to a correlation of 0.73). Including EBAC as an additional predictor in the model resulted in a substantial and significant increase (p < 0.001) in the variance of MBAC explained, increasing it to 75%. As noted earlier, this marked increase in predictability of MBAC by adding in the
16
officer’s EBAC indicates that the officers’ estimates were probably influenced by factors other than the three FSTs
We believe that the accuracy of the SFST can be improved if a weighted sum of scores from the three standard tests is combined as described in Equation 1. However, this relationship should be tested in a variety of populations, and, in a larger sample, it is possible that non-linear and other functions of the test scores may help in prediction. The evaluation should include an assessment of accuracy and bias in estimating the numerical BAC and, as well, the accuracy in classifying individuals above or below specified limits (such as 0.08%) for various low, medium and high levels of measured BAC. In follow-up trials of the FST, the instructions given to officers for converting test scores into estimates of BAC should be stated more explicitly (such as using equation 1 above, or another algorithm). Further, some attempt should be made to identify and incorporate (or control) other factors, aside from the SFST scores, that influence BAC estimates. It may be difficult or impossible to “turn off” other cues that officers use in estimating BAC or in making a decision about an arrest.
The magnitude of the correlations between the tests and MBAC suggests that this type of testing could be developed further, either through re-formulation of the tests, or through different scoring systems, or by other means. In the current framework, the test scores have to be quite high to provide confidence that the subject is above 0.08%, but further development could potentially improve confidence in the three test results, both singly and in combination. And, anticipating the possibility that
17
some jurisdictions may now or in the future have lower (or higher) legal limits than 0.08%, testing could include more representation from lower levels of BrAC.
The SFST total score and sub-test scores are undoubtedly correlated with breath alcohol level (Table 1). However, predicting a numeric blood alcohol concentration from the SFST scores, as the SFST methodology is defined in the Stuster and Burns report, has limited accuracy and precision. The evidence for this is a) considerable over- and under-estimation of MBAC (see Results section); b) a large range of observed MBAC values corresponding to any given total SFST score (Figure 3); and, c) a large spread of observed MBAC values around predicted MBAC values from a liberal regression model that attempts to optimize the use of the SFST, yet has a minimum prediction uncertainty of ±0.09%.
If our interest is not in quantitative prediction, but in classifying individuals, such as below vs. equal to or above a limit of 0.08%, the utility of the SFST depends very much on how intoxicated an individual is. Accuracy (and specificity) are low when individuals are close to 0.08% MBAC (Figure 2 and Table 3), but if the individuals are quite intoxicated, such as above 0.12%, then accuracy is high (Figure 2).
The use of a single test performance statistic, accuracy, and the calculation of this one statistic for the entire study sample is an over-simplification of the more complex relationship between the SFST score and the MBAC level.
18
SFSTs could become more useful if much more data are accumulated and analyzed using statistical methods such as those presented in this paper, including some of the traditional test evaluation statistics. It is likely that the usefulness of SFSTs will be greatest for drivers who have high test scores. The moderate to strong correlations between the tests and MBAC suggest a potential for further test development. Enhanced understanding would come from tests applied to a more diverse population sample as well as from the development of a statistical approach to predicting the probability of a subject having a BAC greater than 0.08 % from a particular set of SFST scores.
19
References:
1. Stuster J, Burns M. Validation of the standardized field sobriety test battery at BACs below 0.10 percent. August, 1998. National Highway Traffic Safety Administration. 2. Burns M, Moskowitz H. Psychophysical tests for DWI arrest. Technical Report DOTHS-5-01242. National Highway Traffic Safety Administration. Washington, DC. 3. Tharp V, Burns M and Moskowitz H. Development and field test of psychophysical tests for DWI arrest. US Department of Transportation, National Highway Traffic Safety Administration Final Report DOT-HS-805-864, Washington, DC. 4. McKnight, AJ, Langston, EA, McKnight AS, Lange, JE. Sobriety tests for low blood alcohol concentrations. Acc Anal & Prevent 2002;34: 305-311. 5. Heishman, SJ, Singleton, EG, Crouch, DJ. Laboratory validation study of drug evaluation and classification program: ethanol, cocaine, and marijuana. J Anal Toxicol 1996; 20: 468-481. 6. Cole S and Nowaczyk, RH. Field sobriety tests: Are they designed for failure? Perceptual and Motor Skills 1994; 79: 99-104. 7. Hlastala M. The alcohol breath test - A brief review. J Appl Physiol 1998; 84: 401408. 8. Hlastala M. Invited editorial on "The alcohol breath test". J Appl Physiol 2002; 93: 405-406. 9. Price P, Cole S. NHTSA field sobriety tests validation v. invalidation, 25 The Champion. 2001; 25: 37-42. 10.Fisher LD, van Belle G. Biostatistics. Wiley, 1993. 11.Weisberg S. Applied linear regression, 2nd edition. Wiley, 1985. 12.NHTSA DWI Detection and Standardized Field Sobriety Testing Student Manual, DOT-HS-178-R1/02.
20
Additional information and reprint requests:
Michael P. Hlastala, Ph.D. Division of Pulmonary and Critical Care Medicine, Department of Medicine Department of Physiology and Biophysics Box 356522 University of Washington Seattle, WA 98195-6522 Email: hlastala@u.washington.edu
21
TABLES
Table 1. Pearson correlation of three Field Sobriety Tests with measured breath alcohol (MBAC) and officer-estimated breath alcohol (EBAC).
TEST MBAC EBAC TOTAL score (3 tests) 0.69 0.74 HGN Horizontal Gaze Nystagmus 0.65 0.71 WAT Walk and turn 0.61 0.64 OLS One leg stand 0.45 0.51
22
Table 2. Accuracy of "over-limit" designation based on estimated breath alcohol concentration for defined cut-points (hypothetical legal "limit") of measured breath alcohol concentration (MBAC)
Legal “limit” (%) N: All N: MBAC < cut-point N: MBAC ! cut-point Accuracy* 0.10 297 107 190 90.6% 0.09 297 97 200 89.2% 0.08 297 83 214 90.6% 0.07 297 69 228 89.6% 0.06 297 58 239 90.6% 0.05 297 43 254 92.3% 0.04 297 29 268 93.9% 0.03 297 19 278 93.9% 0.02 297 9 288 97.6% 0.01 297 4 293 99.3%
*Accuracy = 100%*(# correctly classified as ! limit or < limit)/total
23
Table 3. Accuracy and other statistics related to “over-limit” designation based on estimated breath alcohol concentration for defined ranges of MBAC.
Range of MBAC Total in Range Accuracy Sensitivity Specificity PPV NPV 0.07 – 0.09 36 72% 96% 36% 70% 83% 0.06 – 0.10 65 75% 95% 44% 73% 85% 0.05 – 0.11 97 79% 97% 55% 75% 92% 0.04 – 0.12 135 82% 95% 63% 79% 90% All cases 297 91% 98% 71% 90% 94%
Accuracy = (# correctly classified as ! 0.08 or < 0.08)/total PPV = positive predictive value NPV = negative predictive value
24
Figure Legends:
Figure 1. Estimated BAC vs. Measured BAC for all subjects in the Stuster and Burns study. The line of identity (Estimated BAC = Measured BAC; thin line) and linear regression line (heavy solid line) are shown.
Figure 2. Accuracy of classification of individuals as ! 0.08% or < 0.08% MBAC using the officer estimate. Accuracy is plotted vs. measured breath alcohol concentration (horizontal axis).
Figure 3. Measured breath alcohol concentration versus total of three test scores.
Figure 4. Percent of subjects with MBAC greater than 0.08% vs. the individual test score, with the percentage calculated for all individuals at or above the designated score.
Figure 5. Decision matrix at 0.08% BAC (modified from figure 4 in Stuster and Burns).
Figure 6. Data from Figure 1 expanded to show points between 0.04% and 0.12%. The line of identity (EBAC = MBAC), dashed line and linear regression line (heavy solid line) are shown.
25
Figure 1
26
Figure 2
27
Figure 3.
28
Figure 4.
29
30 Figure 5. Measured BAC (MBAC) Estimated BAC (EBAC) < 0.08% ! 0.08% < 0.08% ! 0.08% N=24 N=210 N=59 N=4 Figure 6.
31
Are Field Sobriety Test Designed for Failure?
Perceptual and Motor Skills, 1994, 79, 99-104. 8 Perceptual and Motor Skills 1994
FIELD SOBRIETY TESTS: ARE THEY DESIGNED FOR FAILURE?'
SPURGEON COLE AND RONALD H. NOWACZYK
Clemson. University
Summary--Field sobriety tests have been used by law enforcement officers to identify alcohol-impaired drivers. Yet in 1981 Tharp. Burns. and Moskowitz found that 32.% of individuals in a laboratory setting who were judged to have an alcohol level above the legal limit actually were below the level. In this study, two groups of seven law enforcement officers each viewed videotapes, of 21 sober individuals performing a variety of field sobriety tests or normal-abilities tests, e.g.. reciting one's address and phone number or walking in a normal manner. Officers judged a significantly larger number of the individuals as impaired when they performed the field sobriety tests than when they performed the normal-abilities tests. The need to reevaluate the predictive validity of field sobriety tests is discussed.
Field sobriety tests have been used throughout this century by police officers to help them assess whether an individual is too impaired to drive an automobile. A classic paper by Bjerver and Goldberg, (1951) examined the relationship between performance on the field sobriety test and driving. Over the past two decades the National Highway Transportation Safety Administration (NHTSA) has funded several studies to examine the effectiveness of field sobriety tests in predicting a person's level of intoxication and driving impairment (e.g., Anderson. Schweitz. & Snyder. 1983; Burns & Moskowitz. 1977; Tharp, Burns, & Moskowitz. 1981).
In a 1977 report, Burns and Moskowitz examined a number of different tests commonly used by officers. Based on the results from a laboratory study, they recommended three tests, the Horizontal Gaze Nystagmus (HGN) test, the walk-and-turn test, and the one leg stand test for further research. The HGN measures the angle of gaze at the onset of jerking movement which can be influenced by alcohol consumption as well as other physiological factors. The other two tests require dividing, attention among mental and physical tasks. Briefly, the walk-and-turn test requires a person to stand on a line in a heel-to-toe position while listening to instructions and then to take nine steps in a heel-to-toe fashion, pivot, and take nine more steps along a straight line. The one-leg stand requires an individual to stand with arms at the side and extend one foot six inches off the ground and maintain that position while counting for 30 seconds without extending the arms or losing balance. (For complete instructions see "DWI Detection and
'Requests for reprints can be sent to either author at the Department of Psychology, Clemson University, Clemson, SC 29634. The authors thank Ronnie Cole for his assistance in the completion of this study and Jack Davenport for his comments on an earlier draft of this manuscript.
100 S. COLE & R.H. NOWACZYK
Divided Attention Field Sobriety Testing" by NHTSA, 1987.) Although these tests seemed to hold the most promise, the authors reported that false alarms are a concern. In the 1977 study, 47 percent of the subjects who would have been arrested based on test performance actually had a blood alcohol concentration (BAC) lower than .10 percent, the decision level used by officers.
A 1981 report by Tharp, et al employed the three previously mentioned tests in another laboratory study. The error rate improved somewhat; 32 percent of the participants judged to have BACs greater than .10 actually had BACs lower than .10, the decision point used in many states for assuming driving impairment. Reliability coefficients for these tests, however, were often below accepted levels for standardized clinical tests. Reliable rests have coefficients of approximately .85 or higher (Rosenthal & Rosnow, 1991). Test-retest reliability coefficients for the field sobriety tests ranged from .61 to .72 for individual tests and .77 for the total test score for 77 individuals who were dosed to the same BAC level on two occasions. Interrater reliability coefficients, based on having different officers score performance on each occasion, were even lower, ranging from .34 to .60 with .57 as an over-all test score.
Problems in scoring can be attributed, in part, to the lack of standardization across many of the field sobriety test studies. In addition, a few miscues in performance can result in an individual being scored as impaired (Anderson, et at.. 1983). For example, a person is viewed as impaired for missing two of nine points on the walk-and-turn test or two of five points on the one-leg stand test. The stringent scoring criteria as well as potential subjectivity in determining whether a point should be awarded may account for accuracy rates that vary from 72 to 96 percent among police agencies using these tests in the Anderson, et al. study. The fact that these tests are largely unfamiliar to most people and not well practiced may make it more difficult for people to perform them. As few as two miscues in performance can result in an individual being classified as impaired because of alcohol consumption when the problem may actually be the result of their unfamiliarity with the rest.
This study tested the hypothesis that sober individuals will find the field sobriety tests difficult to perform and, as a result, will be judged to be impaired by officers viewing their performance. Individuals who were completely sober were asked to perform several field sobriety tests and several "normal-abilities" tests which should be well known to individuals. These latter tests included answering personal data questions, such as stating one's address and phone number, as well as walking in a normal manner. Performance on the field sobriety tests and normal-abilities tests was videotaped. Law enforcement officers were asked to view these tapes and deter-
FIELD SOBRIETY TESTS 101
mine if these individuals were impaired ("too drunk to drive"). If the field sobriety tests are difficult to perform under normal circumstances, then we can expect officers to judge incorrectly individuals as being impaired on the basis of the field sobriety test performance as compared with scores on the normal-abilities tests.
METHOD
Subjects and Design
Fourteen police officers from the local municipality or county sheriff's office rated the performance of 21 individuals who had completed the field sobriety and normal-abilities tests. These officers, with 1 to 17 years of law enforcement experience (M = 11.7 yr.) were volunteers who were certified by the South Carolina Academy for Police Officers which is a state requirement. As part of this certification requirement they had completed the state DUI training program and have had field experience with DUI detection. All officers were assigned to duties in the field.
Ten males, seven white and three African-American. and eleven white females served as participants. They were recruited from local businesses. The owners of these businesses were asked if they had any employees who were willing to volunteer to serve in an experiment involving psychomotor tasks. Participants were currently employed, between 21 and 55 years of age, and not overweight, and had no known physical disabilities.
All individuals and officers were paid for their participation. The individuals performed both field sobriety tests as well as normal-abilities tests. Half of the officers were randomly assigned to each condition in which they viewed performance on either the field sobriety or normal- abilities tests.
Tests Performed
Prior to the administration of the tests, each participant was administered the Datamaster breathalyzer test. All participants had a BAC level of .00. Each participant performed six field sobriety tests and four normal-abilities tests in the same order in an indoor setting. The field sobriety tests included the walk-and-turn test, alphabet recitation, one-leg stand, a one-leg stand while tilting backward with the eyes closed and touching the nose, a one-leg stand with counting, and a one-leg extension test. These tests were selected after interviewing a number of officers concerning tests they used in the field. None of these officers served in this study. The Horizontal Gaze Nystagmus test was not included because it requires officers individually to monitor the participants' eye movements which would have been difficult to videotape in a controlled fashion. It is also not included in the 1987 NHTSA self-instructional guide (NHTSA, 1987). The four normal-abilities tests included counting from 1 to 10, reciting one's Social Security number, driver's license number or date of birth, recit-
102 S. COLE & R. H. NOWACZYK
ing one's home address and phone number, and walking in a normal manner, turning around, and walking back to the starting point. These tests were selected by the experimenters to sample motor and cognitive activities that are commonly performed by most individuals.
Standard instructions for each test were read by the experimenter. Participants were told that they would perform a number of motor-coordination tasks that would last approximately 30 minutes. These instructions were based on those used by law enforcement in South Carolina and followed NHTSA guidelines. If participants had questions regarding the instructions, the experimenter reread the appropriate section. The reading of instructions was included on the videotape. The tests were performed indoors in a meeting room where distractions were minimal. A 7.62-cm wide strip of tape was placed on the floor for the walk-and-turn test as per NHTSA requirements.
Procedure
Each officer watched a videotape of the 21 individuals performing one of the two sets of tests. The order of performance of the individuals was the same for both the field sobriety tests and normal-abilities tests. The officers were provided with sheets of paper listing the participants by number. The officers were allowed to take notes and were asked "Do you fee!, as a law enforcement officer, that the following subjects, based on field sobriety tests performed on videotape, have had too much to drink to drive.
Their responses, either "yes" or "no," were recorded for each individual. The decision was recorded by the officer immediately, after viewing the individual's performance and prior to viewing the next individual's performance. Eachofficer participated in individual sessions.
RESULTS
The proportion of officers who decided that an individual had "too much to drink" was recorded for each individual separately for the field sobriety and normal-abilities tests. There was a significant difference as a function of test (t29 = 4.38, p<.01). Forty-six percent of the officers' decisions were that an individual had "too much to drink" from viewing the field sobriety tests. Fifteen percent of the decisions from the normal-abilities tests were that a person had "too much to drink."
Differences among individuals were apparent. Only three individuals were rated as "unimpaired" by ail officers on both the field sobriety and normal-abilities tests. One individual's performance was rated as showing he had had "too much to drink" based more on the normal-abilities tests (by three officers) than on the field sobriety tests (none of the officers). Five individuals were rated as having had "too much to drink" by all the officers who viewed the field sobriety tests. One other individual was rated as having had "too much to drink" by all but one officer. Of these six individuals
FIELD SOBRIETY TESTS 103
only one was rated as "impaired" by as many as four of the officers who saw the same individuals performing the normal-abilities tests. Four of these individuals were rated as having had "too much to drink" by two or fewer of the officers viewing the normal-abilities tests.
Discussion
The data indicate that judgments of impairment are influenced by the type of test performed. An individual was more liken to be judged as impaired on the basis of field sobriety test performance than on performance of the normal-abilities tests. Even without alcohol, the number of errors made by individuals performing the field sobriety tests was sufficient for officers to judge that the individuals had had too much to drink. These findings are consistent with other studies reporting sizable percentages of individuals judged to be impaired when they were not (Burns & Moskowitz, 1977; Tharp, et al, 1981).
While training of officers, standardization of test instructions, administration, and scoring may reduce the number of incorrect classifications, the major obstacle may be the field sobriety tests. The fact that these tests require unfamiliar and unpracticed motor sequences may put an individual at a disadvantage when performing them. To the law enforcement officer who has demonstrated the tests many times, the motor sequences may, seem easy and straightforward. It may also be that to the casual observer that the tests are easy to perform. Yet, when an untrained individual actually performs the test, then the difficulty of performing the tests at an acceptable level may become evident.
The reliance on field sobriety test performance by law enforcement officers in their decision to arrest or not and by juries in their decision whether to convict a person of driving under the influence underscores the need to examine field sobriety tests critically. The tests should discriminate between the two populations of individuals who are impaired and those who are not. Ideally, the tests should separate the two populations, that is, increase d, the mean difference between the two populations. The tests, however, may be doing nothing more than adjusting the officer=s β, or criterion measure, downward.
These tests must be held to the same standards the scientific community would expect of any reliable and valid test of behavior. This study brings the validity of field sobriety tests into question. If law enforcement officials and the courts wish to continue to use field sobriety tests as evidence of driving impairment, then further study needs to be conducted addressing the direct relationship of performance on these and other tests with driving. To date, research has concentrated on the relationship between test performance and BAC and officers' perceptions of impairment. This study indicates that these perceptions may be faulty.
104 S. COLE & R. H. NOWACZYK
REFERENCES
Anderson, T. E., Schweitz, M. B (1983) M. B. (1983) Field evaluation of a behavioral battery for DWI. Final Report, DOT-HS-806476.
Bjerver, K. &: Goldberg, L. (1951} Effect of alcohol ingestion on driving ability: results of practical road tests and laboratory experiments. Quarterly Journal of Studies on Alcohol, 11, 1-30.
Burns, M., & Moskowitz, H. (1977) Psychophysical tests for DWI arrest. Final Report, DOT-HS-802-424, NHTSA. '
NHTSA. (1987) DWI Detection and Divided Attention Field Sobriety Testing. Final Report, DOT-HS-807-186.
Rosenthal, R., &: Rosnow, R. L. (1991) Essentials of behavioral research methods and data analysis. (2nd ed.) New York: McGraw-Hill.
Tharp, V., Burns, M., & Moskowitz, H. (1981) Development and field test of psychophysical
tests for DWI arrests. Final Report, DOT-HS-805-864, NH'ISA.
Accepted May 23. 1994.
FIELD SOBRIETY TESTS: ARE THEY DESIGNED FOR FAILURE?'
SPURGEON COLE AND RONALD H. NOWACZYK
Clemson. University
Summary--Field sobriety tests have been used by law enforcement officers to identify alcohol-impaired drivers. Yet in 1981 Tharp. Burns. and Moskowitz found that 32.% of individuals in a laboratory setting who were judged to have an alcohol level above the legal limit actually were below the level. In this study, two groups of seven law enforcement officers each viewed videotapes, of 21 sober individuals performing a variety of field sobriety tests or normal-abilities tests, e.g.. reciting one's address and phone number or walking in a normal manner. Officers judged a significantly larger number of the individuals as impaired when they performed the field sobriety tests than when they performed the normal-abilities tests. The need to reevaluate the predictive validity of field sobriety tests is discussed.
Field sobriety tests have been used throughout this century by police officers to help them assess whether an individual is too impaired to drive an automobile. A classic paper by Bjerver and Goldberg, (1951) examined the relationship between performance on the field sobriety test and driving. Over the past two decades the National Highway Transportation Safety Administration (NHTSA) has funded several studies to examine the effectiveness of field sobriety tests in predicting a person's level of intoxication and driving impairment (e.g., Anderson. Schweitz. & Snyder. 1983; Burns & Moskowitz. 1977; Tharp, Burns, & Moskowitz. 1981).
In a 1977 report, Burns and Moskowitz examined a number of different tests commonly used by officers. Based on the results from a laboratory study, they recommended three tests, the Horizontal Gaze Nystagmus (HGN) test, the walk-and-turn test, and the one leg stand test for further research. The HGN measures the angle of gaze at the onset of jerking movement which can be influenced by alcohol consumption as well as other physiological factors. The other two tests require dividing, attention among mental and physical tasks. Briefly, the walk-and-turn test requires a person to stand on a line in a heel-to-toe position while listening to instructions and then to take nine steps in a heel-to-toe fashion, pivot, and take nine more steps along a straight line. The one-leg stand requires an individual to stand with arms at the side and extend one foot six inches off the ground and maintain that position while counting for 30 seconds without extending the arms or losing balance. (For complete instructions see "DWI Detection and
'Requests for reprints can be sent to either author at the Department of Psychology, Clemson University, Clemson, SC 29634. The authors thank Ronnie Cole for his assistance in the completion of this study and Jack Davenport for his comments on an earlier draft of this manuscript.
100 S. COLE & R.H. NOWACZYK
Divided Attention Field Sobriety Testing" by NHTSA, 1987.) Although these tests seemed to hold the most promise, the authors reported that false alarms are a concern. In the 1977 study, 47 percent of the subjects who would have been arrested based on test performance actually had a blood alcohol concentration (BAC) lower than .10 percent, the decision level used by officers.
A 1981 report by Tharp, et al employed the three previously mentioned tests in another laboratory study. The error rate improved somewhat; 32 percent of the participants judged to have BACs greater than .10 actually had BACs lower than .10, the decision point used in many states for assuming driving impairment. Reliability coefficients for these tests, however, were often below accepted levels for standardized clinical tests. Reliable rests have coefficients of approximately .85 or higher (Rosenthal & Rosnow, 1991). Test-retest reliability coefficients for the field sobriety tests ranged from .61 to .72 for individual tests and .77 for the total test score for 77 individuals who were dosed to the same BAC level on two occasions. Interrater reliability coefficients, based on having different officers score performance on each occasion, were even lower, ranging from .34 to .60 with .57 as an over-all test score.
Problems in scoring can be attributed, in part, to the lack of standardization across many of the field sobriety test studies. In addition, a few miscues in performance can result in an individual being scored as impaired (Anderson, et at.. 1983). For example, a person is viewed as impaired for missing two of nine points on the walk-and-turn test or two of five points on the one-leg stand test. The stringent scoring criteria as well as potential subjectivity in determining whether a point should be awarded may account for accuracy rates that vary from 72 to 96 percent among police agencies using these tests in the Anderson, et al. study. The fact that these tests are largely unfamiliar to most people and not well practiced may make it more difficult for people to perform them. As few as two miscues in performance can result in an individual being classified as impaired because of alcohol consumption when the problem may actually be the result of their unfamiliarity with the rest.
This study tested the hypothesis that sober individuals will find the field sobriety tests difficult to perform and, as a result, will be judged to be impaired by officers viewing their performance. Individuals who were completely sober were asked to perform several field sobriety tests and several "normal-abilities" tests which should be well known to individuals. These latter tests included answering personal data questions, such as stating one's address and phone number, as well as walking in a normal manner. Performance on the field sobriety tests and normal-abilities tests was videotaped. Law enforcement officers were asked to view these tapes and deter-
FIELD SOBRIETY TESTS 101
mine if these individuals were impaired ("too drunk to drive"). If the field sobriety tests are difficult to perform under normal circumstances, then we can expect officers to judge incorrectly individuals as being impaired on the basis of the field sobriety test performance as compared with scores on the normal-abilities tests.
METHOD
Subjects and Design
Fourteen police officers from the local municipality or county sheriff's office rated the performance of 21 individuals who had completed the field sobriety and normal-abilities tests. These officers, with 1 to 17 years of law enforcement experience (M = 11.7 yr.) were volunteers who were certified by the South Carolina Academy for Police Officers which is a state requirement. As part of this certification requirement they had completed the state DUI training program and have had field experience with DUI detection. All officers were assigned to duties in the field.
Ten males, seven white and three African-American. and eleven white females served as participants. They were recruited from local businesses. The owners of these businesses were asked if they had any employees who were willing to volunteer to serve in an experiment involving psychomotor tasks. Participants were currently employed, between 21 and 55 years of age, and not overweight, and had no known physical disabilities.
All individuals and officers were paid for their participation. The individuals performed both field sobriety tests as well as normal-abilities tests. Half of the officers were randomly assigned to each condition in which they viewed performance on either the field sobriety or normal- abilities tests.
Tests Performed
Prior to the administration of the tests, each participant was administered the Datamaster breathalyzer test. All participants had a BAC level of .00. Each participant performed six field sobriety tests and four normal-abilities tests in the same order in an indoor setting. The field sobriety tests included the walk-and-turn test, alphabet recitation, one-leg stand, a one-leg stand while tilting backward with the eyes closed and touching the nose, a one-leg stand with counting, and a one-leg extension test. These tests were selected after interviewing a number of officers concerning tests they used in the field. None of these officers served in this study. The Horizontal Gaze Nystagmus test was not included because it requires officers individually to monitor the participants' eye movements which would have been difficult to videotape in a controlled fashion. It is also not included in the 1987 NHTSA self-instructional guide (NHTSA, 1987). The four normal-abilities tests included counting from 1 to 10, reciting one's Social Security number, driver's license number or date of birth, recit-
102 S. COLE & R. H. NOWACZYK
ing one's home address and phone number, and walking in a normal manner, turning around, and walking back to the starting point. These tests were selected by the experimenters to sample motor and cognitive activities that are commonly performed by most individuals.
Standard instructions for each test were read by the experimenter. Participants were told that they would perform a number of motor-coordination tasks that would last approximately 30 minutes. These instructions were based on those used by law enforcement in South Carolina and followed NHTSA guidelines. If participants had questions regarding the instructions, the experimenter reread the appropriate section. The reading of instructions was included on the videotape. The tests were performed indoors in a meeting room where distractions were minimal. A 7.62-cm wide strip of tape was placed on the floor for the walk-and-turn test as per NHTSA requirements.
Procedure
Each officer watched a videotape of the 21 individuals performing one of the two sets of tests. The order of performance of the individuals was the same for both the field sobriety tests and normal-abilities tests. The officers were provided with sheets of paper listing the participants by number. The officers were allowed to take notes and were asked "Do you fee!, as a law enforcement officer, that the following subjects, based on field sobriety tests performed on videotape, have had too much to drink to drive.
Their responses, either "yes" or "no," were recorded for each individual. The decision was recorded by the officer immediately, after viewing the individual's performance and prior to viewing the next individual's performance. Eachofficer participated in individual sessions.
RESULTS
The proportion of officers who decided that an individual had "too much to drink" was recorded for each individual separately for the field sobriety and normal-abilities tests. There was a significant difference as a function of test (t29 = 4.38, p<.01). Forty-six percent of the officers' decisions were that an individual had "too much to drink" from viewing the field sobriety tests. Fifteen percent of the decisions from the normal-abilities tests were that a person had "too much to drink."
Differences among individuals were apparent. Only three individuals were rated as "unimpaired" by ail officers on both the field sobriety and normal-abilities tests. One individual's performance was rated as showing he had had "too much to drink" based more on the normal-abilities tests (by three officers) than on the field sobriety tests (none of the officers). Five individuals were rated as having had "too much to drink" by all the officers who viewed the field sobriety tests. One other individual was rated as having had "too much to drink" by all but one officer. Of these six individuals
FIELD SOBRIETY TESTS 103
only one was rated as "impaired" by as many as four of the officers who saw the same individuals performing the normal-abilities tests. Four of these individuals were rated as having had "too much to drink" by two or fewer of the officers viewing the normal-abilities tests.
Discussion
The data indicate that judgments of impairment are influenced by the type of test performed. An individual was more liken to be judged as impaired on the basis of field sobriety test performance than on performance of the normal-abilities tests. Even without alcohol, the number of errors made by individuals performing the field sobriety tests was sufficient for officers to judge that the individuals had had too much to drink. These findings are consistent with other studies reporting sizable percentages of individuals judged to be impaired when they were not (Burns & Moskowitz, 1977; Tharp, et al, 1981).
While training of officers, standardization of test instructions, administration, and scoring may reduce the number of incorrect classifications, the major obstacle may be the field sobriety tests. The fact that these tests require unfamiliar and unpracticed motor sequences may put an individual at a disadvantage when performing them. To the law enforcement officer who has demonstrated the tests many times, the motor sequences may, seem easy and straightforward. It may also be that to the casual observer that the tests are easy to perform. Yet, when an untrained individual actually performs the test, then the difficulty of performing the tests at an acceptable level may become evident.
The reliance on field sobriety test performance by law enforcement officers in their decision to arrest or not and by juries in their decision whether to convict a person of driving under the influence underscores the need to examine field sobriety tests critically. The tests should discriminate between the two populations of individuals who are impaired and those who are not. Ideally, the tests should separate the two populations, that is, increase d, the mean difference between the two populations. The tests, however, may be doing nothing more than adjusting the officer=s β, or criterion measure, downward.
These tests must be held to the same standards the scientific community would expect of any reliable and valid test of behavior. This study brings the validity of field sobriety tests into question. If law enforcement officials and the courts wish to continue to use field sobriety tests as evidence of driving impairment, then further study needs to be conducted addressing the direct relationship of performance on these and other tests with driving. To date, research has concentrated on the relationship between test performance and BAC and officers' perceptions of impairment. This study indicates that these perceptions may be faulty.
104 S. COLE & R. H. NOWACZYK
REFERENCES
Anderson, T. E., Schweitz, M. B (1983) M. B. (1983) Field evaluation of a behavioral battery for DWI. Final Report, DOT-HS-806476.
Bjerver, K. &: Goldberg, L. (1951} Effect of alcohol ingestion on driving ability: results of practical road tests and laboratory experiments. Quarterly Journal of Studies on Alcohol, 11, 1-30.
Burns, M., & Moskowitz, H. (1977) Psychophysical tests for DWI arrest. Final Report, DOT-HS-802-424, NHTSA. '
NHTSA. (1987) DWI Detection and Divided Attention Field Sobriety Testing. Final Report, DOT-HS-807-186.
Rosenthal, R., &: Rosnow, R. L. (1991) Essentials of behavioral research methods and data analysis. (2nd ed.) New York: McGraw-Hill.
Tharp, V., Burns, M., & Moskowitz, H. (1981) Development and field test of psychophysical
tests for DWI arrests. Final Report, DOT-HS-805-864, NH'ISA.
Accepted May 23. 1994.
Colorado Validation Study of SFST's
A Colorado Validation Study of the Standardized Field Sobriety Test (SFST) Battery
Final Report Submitted to
Colorado Department of Transportation
November 1995
Marcelline Burns, Ph.D. Ellen W. Anderson, Deputy
Southern California Research Institute Pitkin County Sheriff’s Office
Los Angeles, California Aspen, Colorado
This report was funded by the Office of Transportation Safety, Colorado Department of Transportation
(Utilizing National Highway Traffic Safety Administration funds, under Project Number 95-408-17-05).
I. Introduction
A battery of standardized field sobriety tests (SFSTs), which was developed under National Highway Traffic Safety (NHTSA) funding during the 1970's, is now used by police officers nationwide. Traffic officers in fifty states, who have been trained in standardized administration of the tests, routinely use them and incorporate their observations of drivers’ test performance into their arrest or release decisions. Defense attorneys, however, often challenge the admissibility of court testimony about the test battery.
Roadside decisions are a critical components of alcohol-and-driving enforcement, and, therefore, of traffic safety. Because the SFSTs aid officers in the often-difficult task of identifying alcohol-impaired drivers, it is likely that the tests have contributed in some unknown measure to the significant decline in alcohol-related fatalities over the last decade. Given that they have exerted a positive impact on traffic safety, it is important to resolve questions about their validity and reliability, to maintain their credibility, and to preserve them as a roadside tool.
Because court arguments about SFSTs focus largely on the research conducted at the Southern California Research Institute (SCRI) and because that research is sometimes misrepresented or misunderstood, it is necessary first to clarify its purpose. Two large-scale laboratory experiments were conducted for the purpose of identifying and standardizing a “best” set of tests (Burns and Moskowitz, 1977; Tharp, burns and Moskowitz, 1981). Although it clearly is relevant at this point in time to inquire whether the methods of those experiments were scientifically sound, it should be recognized that the laboratory data are now only indirectly enlightening about current roadside use of the tests. In particular, note that controlled laboratory conditions are less variable and, therefore, may be less challenging than the highly varied conditions which officers routinely encounter in the field.
Also, officer experience with the SFSTs is key to the skill and confidence with which they use them as a basis for their decisions. Thus it is important to understand that the officers who participated in the SCRI studies had not been trained with the SFSTs until just prior to the experiments. They had not had opportunity and time to gain skill or to develop confidence in the tests. In contrast, many of the officers who now use and testify about the tests have been using them regularly for ten or more years, and it is reasonable to assume they have gained skill and to expect that their decisions based on the tests may be more accurate than those of the officers during the initial research.
The question to be addressed in 1995 by agencies, officers and the courts is, “How accurate are the arrest decisions which are made by experienced, skilled officers under roadside conditions when they rely on SFSTs?”. A broadly applicable answer cannot be found in laboratory research. It requires field data; i.e., information about real-world arrest decisions by officers trained by NHTSA guidelines to administer the SFSTs.
The Colorado Department of Transportation funded a 1995 study to obtain such data. Through a grant to the Pitkin County Sheriff’s Office and with the cooperative effort of seven Colorado law enforcement agencies, records were collected from drivers tested with the SFSTs at roadside. The seven agencies were:
Aspen Police Department (APD)
Basalt Police Department (BPD)
Boulder County Sheriff’s Office (BCSO)
Colorado State Patrol (CSP)
Lakewood Police Department (LPD)
Pitkin County Sheriff’s Office (PCSO)
Snowmass Village Police Dept (SVPD)
With information drawn from impaired-driving records, a data base was created and analyzed at the Souther California Research Institute.
Technical Summary
In the State of Colorado, motor vehicle operators are subject to arrest if they are found to be driving with a blood alcohol concentration (BAC) of 0.05% or higher. At BACs of 0.05% or higher but less than 0.10%, they are charged with Driving While Ability Impaired (DWAI). At BACs of 0.10% and higher, the charge is Driving Under the Influence (DUI). These statutes reflect the evidence from both epidemiological and laboratory studies of alcohol impairment of driving skills.
It is the responsibility of law enforcement officers to detect and arrest alcohol-influenced drivers in accordance with these statutory limits. In an efforts to meet that objective, police officers, not only in Colorado but in all fifty of the United States, rely on a battery of standardized field sobriety tests (SFSTs). Observations of drivers’ performance of the tests, together with driving pattern, appearance and manner, odor of alcohol, and other signs, underlie officers’ arrest and release decisions.
To be genuinely useful, roadside tests must be valid and reliable; i.e., they must measure changes in performance associated with alcohol and they must do it consistently. To the extent that they meet the validity and reliability criteria, they can be expected to contribute to traffic safety by increasing the likelihood that alcohol-impaired drivers will be removed from the roadway by arrest. Importantly, they also will further serve the driving public’s interest by decreasing the likelihood that a driver who is not alcohol-impaired will be mistakenly detained or arrested. Thus, the validity and reliability of the tests are important issues.
This study was undertaken specifically to extend study of the SFSTs from the laboratory setting to field use. The primary study question was, “How accurate are officers’ arrest and release decisions when the SFSTs are used by trained and experienced officers?” Over a five-month period, officers from seven Colorado law enforcement agencies who volunteered for the study provided the records (N=305) from every administration of the SFSTs.
Using only the standardized 3-test battery (Walk-and-Turn, One-Leg Stand, Horizontal Gaze Nystagmus), officers seldom erred when they decided to arrest a driver. Breath or blood specimens confirmed that 93% of the arrested drivers were above 0.05% BAC. Officers were more likely to err on the side of releasing drivers than on the side of incorrectly arresting drivers. Given the difficulty of the task which confronts officers at roadside, in particular with alcohol-tolerant individuals, the finding that approximately one-third of the released drivers should have been arrested is not unexpected. However, it is important to note that officers’ decisions to release were correct two-thirds of the time.
Overall, 86% of the officers’ decisions to arrest or release drivers who provided blood or breath specimens were correct.
It is concluded that the SFSTs are valid tests; i.e., they serve as indices of the presence of alcohol at impairing levels. The study design did not support an examination of test-retest reliability. It should be noted, however, that the test battery appears to have served equally well across agencies and officers, strongly suggesting that it achieves acceptable reliability as well.
III. Study Design
This study was designed to:
(1) gather data to assign officers’ decisions to the four cells of the decision matrix illustrated in Figure 1, and to
(2) examine the accuracy of the SFST battery when used in the widely varying weather conditions of Colorado winter, spring, and summer months.
Both the design and the execution of the study focused on the integrity, completeness, and standardization of the data.
It is important to note how the study population was defined and how the sample of subjects was drawn. Subjects were a subset of the population of drivers who were detained by police officers during the study period. They were drivers, both those arrested and those released, who were stopped by police officers during the study period and who were requested to perform the SFSTs. The officers’ decisions about those drivers have been analyzed in terms of correct decisions (Correct Arrests and Correct Releases) and errors (Incorrect Arrests and Incorrect Releases).
In a broader context, the terms Correct Releases and Incorrect Releases could be extended to motorists who were stopped but who were not asked to perform the SFSTs. In many of those cases, the release decisions were correct, but it is likely that some of there were impaired drivers who were released without ever being asked to perform the SFSTs. Those individuals and those decisions are of interest and would be included in an assessment of overall proficiency in DUI detection and arrest. In fact, the entire population of impaired drivers, only some of whom are detected and stopped, is of interest in terms of traffic safety. In a validation study of SFSTs, however, the subjects were only those drivers who were asked to perform the tests.
VI. Summary and Discussion
In 1995, there is a sound base of scientific evidence to support the use of 0.10%, 0.08%, and 0.05% BACs as presumptive and per se alcohol limits for drivers. There also appears to be strong support for those statutes among citizens throughout broad (though not all) segments of society. A clear-cut shift of attitude over the past ten to fifteen years has resulted in anti-drunk driving sentiments by much of the driving population. In many social circles drinking-and-driving now is unacceptable behavior.
Why then, in a largely pro-alcohol enforcement climate, are there negative views of traffic officers’ related activities? Citizens often seem to believe that enforcement is hit-or-miss and that officers regularly fail to remove many, if not most, alcohol-impaired drivers from the roadway. Some also seem to believe that the activities at roadside are arbitrary and calculated to harass. Although the multifaceted social and individual variables that underlie this paradox of concurrent anti-enforcement sentiment and anti-drunk driving sentiment are beyond the scope of this report, it is germane to consider one set of factors. At least part of this view of alcohol enforcement is attributable to a general failure to recognize the importance of traffic officers’ duties, and to understand not only what their duties encompass but also the difficulty of their task.
Legislators, regulatory agencies, activities groups, and safety-conscious citizens alike sometimes appear to overlook the fact that traffic officers are pivotal in the deterrence of drunk driving. Unless officers are able to detect and arrest impaired drivers, those drivers will never enter the system of sanctions and, therefore, the existence of enabling statutes and anti-drunk driving sentiment will be largely irrelevant to them. Unfortunately, it is also true that the escape of detection and arrest on multiple occasions serves to reinforce the risky behavior. In effect, if no accident and no arrest occur on one or more occasions of drinking and driving, the citizen may conclude that driving after drinking is acceptable behavior on other occasions.
For a number of reasons, the difficulties associated with traffic officers’ alcohol-enforcement responsibilities typically are underestimated. One reason is the misnomer “drunk driving,” which suggests that their duty is to apprehend “drunks” or obviously-intoxicated individuals. If that were indeed the sole definition of alcohol enforcement duties, the task would be fairly straightforward. In reality, the risks associated with drinking and driving are not limited to obviously-intoxicated drivers, nor are officers’ enforcement responsibilities restricted to those drivers.
Traffic officers are responsible for removing alcohol-impaired drivers from the roadway, and the Colorado statute sets the criterion alcohol levels at 0.10% and 0.05% BAC. In other jurisdictions the BAC limit is 0.08%, with additional lower levels for lesser charges and specific driver groups. Enforcement problems arise in part from the fact that although the evidence clearly establishes that driving skills are impaired at 0.10% BAC and lower, many, possibly even most, individuals who are willing to drive after drinking are not obviously intoxicated at those levels.
Leaving aside the problem of detecting alcohol impairment by the observation of driving behaviors, consider officers’ task once they stop vehicles and contact drivers at roadside. Working under widely-varying conditions without special measurement apparatus, they must decide within a few minutes whether a specific driver is impaired by alcohol. Impaired drivers may or may not display atypical speech, appearance, or other personal characteristics, but in either circumstance the officers have no knowledge of any given driver’s sober appearance and behavior. The task is further complicated by the tolerant drinker’s normal appearance even at very high BACs.
Are there signs and symptoms which are reliably associated with 0.05% and 0.10%? With what level of confidence can the officer arrest or release a driver? With a decision criterion that minimizes incorrect arrests, the risk of releasing impaired drivers rises. On the other hand, a very strict decision criterion will decrease the number of impaired drivers who are released but at the risk of unnecessarily detaining non-impaired drivers. Is one risk preferable to the other? These questions define the context of traffic officers’ alcohol enforcement activities and the background of the Colorado Validation Study of the SFSTs.
The records collected and analyzed during this study provide evidence that the SFSTs, as used at roadside by trained and experienced law enforcement officers, are valid indices of the presence of alcohol.
Records of all driver contacts, which resulted in administration of the SFSTs during the study period, were entered into the analysis. Overall, for 234 cases confirmed by breath or blood tests, officers’ decisions to arrest and release were 86% correct, and 93% of their arrest decisions were correct.
It was not unexpected to find that officers were almost twice as likely to release incorrectly as to arrest incorrectly. Nonetheless, only 36% of the released drivers were at or above the statutory limit.
These findings obtained in the field with officers experienced with the use of SFSTs can be compared with findings from a laboratory setting with officers recently trained with the SFSTs. It should be kept in mind that the current data are not fully comparable to data from laboratory experiments, since there are differences other than time-since-training and laboratory vs. field. With that caution, the comparisons are instructive.
In an initial study of field sobriety tests with 238 laboratory subjects, officers’ decisions overall were 76% correct (Burns and Moskowitz, 1977). Only 54% of their arrest decisions were correct, and only 8% of their release decisions were incorrect. In a second laboratory study, officers’ decisions overall were 81% correct, their arrest decisions were 68% correct, and 14% of their release decisions were wrong (Tharp, Burns and Moskowitz, 1981). It is apparent that the arrest criterion was lower in the laboratory. The penalties for mistakes in a laboratory setting are, of course, fairly trivial compared to a real-world setting. The lower criterion, together with lack of experience with the tests, accounts for higher rates of incorrect arrests and lower rates of incorrect releases than found in this study. It is not surprising to find that officers in the field require more certainty about arresting a citizen and adopt a higher criterion with the result that they err in the direction of incorrect releases.
In summary, the data provide clear-cut findings about the use of SFSTs by officers in six Colorado communities. On a broader scale, they provide partial and tentative answers to some important questions. It is hoped that current data from a field setting will facilitate court proceedings with drivers arrested on DUI and DWAI charges. It is hoped, too, that the content of this report will add to the driving public’s understanding of roadside enforcement activities, as well as to recognition of police officers’ critical role in traffic safety.
Final Report Submitted to
Colorado Department of Transportation
November 1995
Marcelline Burns, Ph.D. Ellen W. Anderson, Deputy
Southern California Research Institute Pitkin County Sheriff’s Office
Los Angeles, California Aspen, Colorado
This report was funded by the Office of Transportation Safety, Colorado Department of Transportation
(Utilizing National Highway Traffic Safety Administration funds, under Project Number 95-408-17-05).
I. Introduction
A battery of standardized field sobriety tests (SFSTs), which was developed under National Highway Traffic Safety (NHTSA) funding during the 1970's, is now used by police officers nationwide. Traffic officers in fifty states, who have been trained in standardized administration of the tests, routinely use them and incorporate their observations of drivers’ test performance into their arrest or release decisions. Defense attorneys, however, often challenge the admissibility of court testimony about the test battery.
Roadside decisions are a critical components of alcohol-and-driving enforcement, and, therefore, of traffic safety. Because the SFSTs aid officers in the often-difficult task of identifying alcohol-impaired drivers, it is likely that the tests have contributed in some unknown measure to the significant decline in alcohol-related fatalities over the last decade. Given that they have exerted a positive impact on traffic safety, it is important to resolve questions about their validity and reliability, to maintain their credibility, and to preserve them as a roadside tool.
Because court arguments about SFSTs focus largely on the research conducted at the Southern California Research Institute (SCRI) and because that research is sometimes misrepresented or misunderstood, it is necessary first to clarify its purpose. Two large-scale laboratory experiments were conducted for the purpose of identifying and standardizing a “best” set of tests (Burns and Moskowitz, 1977; Tharp, burns and Moskowitz, 1981). Although it clearly is relevant at this point in time to inquire whether the methods of those experiments were scientifically sound, it should be recognized that the laboratory data are now only indirectly enlightening about current roadside use of the tests. In particular, note that controlled laboratory conditions are less variable and, therefore, may be less challenging than the highly varied conditions which officers routinely encounter in the field.
Also, officer experience with the SFSTs is key to the skill and confidence with which they use them as a basis for their decisions. Thus it is important to understand that the officers who participated in the SCRI studies had not been trained with the SFSTs until just prior to the experiments. They had not had opportunity and time to gain skill or to develop confidence in the tests. In contrast, many of the officers who now use and testify about the tests have been using them regularly for ten or more years, and it is reasonable to assume they have gained skill and to expect that their decisions based on the tests may be more accurate than those of the officers during the initial research.
The question to be addressed in 1995 by agencies, officers and the courts is, “How accurate are the arrest decisions which are made by experienced, skilled officers under roadside conditions when they rely on SFSTs?”. A broadly applicable answer cannot be found in laboratory research. It requires field data; i.e., information about real-world arrest decisions by officers trained by NHTSA guidelines to administer the SFSTs.
The Colorado Department of Transportation funded a 1995 study to obtain such data. Through a grant to the Pitkin County Sheriff’s Office and with the cooperative effort of seven Colorado law enforcement agencies, records were collected from drivers tested with the SFSTs at roadside. The seven agencies were:
Aspen Police Department (APD)
Basalt Police Department (BPD)
Boulder County Sheriff’s Office (BCSO)
Colorado State Patrol (CSP)
Lakewood Police Department (LPD)
Pitkin County Sheriff’s Office (PCSO)
Snowmass Village Police Dept (SVPD)
With information drawn from impaired-driving records, a data base was created and analyzed at the Souther California Research Institute.
Technical Summary
In the State of Colorado, motor vehicle operators are subject to arrest if they are found to be driving with a blood alcohol concentration (BAC) of 0.05% or higher. At BACs of 0.05% or higher but less than 0.10%, they are charged with Driving While Ability Impaired (DWAI). At BACs of 0.10% and higher, the charge is Driving Under the Influence (DUI). These statutes reflect the evidence from both epidemiological and laboratory studies of alcohol impairment of driving skills.
It is the responsibility of law enforcement officers to detect and arrest alcohol-influenced drivers in accordance with these statutory limits. In an efforts to meet that objective, police officers, not only in Colorado but in all fifty of the United States, rely on a battery of standardized field sobriety tests (SFSTs). Observations of drivers’ performance of the tests, together with driving pattern, appearance and manner, odor of alcohol, and other signs, underlie officers’ arrest and release decisions.
To be genuinely useful, roadside tests must be valid and reliable; i.e., they must measure changes in performance associated with alcohol and they must do it consistently. To the extent that they meet the validity and reliability criteria, they can be expected to contribute to traffic safety by increasing the likelihood that alcohol-impaired drivers will be removed from the roadway by arrest. Importantly, they also will further serve the driving public’s interest by decreasing the likelihood that a driver who is not alcohol-impaired will be mistakenly detained or arrested. Thus, the validity and reliability of the tests are important issues.
This study was undertaken specifically to extend study of the SFSTs from the laboratory setting to field use. The primary study question was, “How accurate are officers’ arrest and release decisions when the SFSTs are used by trained and experienced officers?” Over a five-month period, officers from seven Colorado law enforcement agencies who volunteered for the study provided the records (N=305) from every administration of the SFSTs.
Using only the standardized 3-test battery (Walk-and-Turn, One-Leg Stand, Horizontal Gaze Nystagmus), officers seldom erred when they decided to arrest a driver. Breath or blood specimens confirmed that 93% of the arrested drivers were above 0.05% BAC. Officers were more likely to err on the side of releasing drivers than on the side of incorrectly arresting drivers. Given the difficulty of the task which confronts officers at roadside, in particular with alcohol-tolerant individuals, the finding that approximately one-third of the released drivers should have been arrested is not unexpected. However, it is important to note that officers’ decisions to release were correct two-thirds of the time.
Overall, 86% of the officers’ decisions to arrest or release drivers who provided blood or breath specimens were correct.
It is concluded that the SFSTs are valid tests; i.e., they serve as indices of the presence of alcohol at impairing levels. The study design did not support an examination of test-retest reliability. It should be noted, however, that the test battery appears to have served equally well across agencies and officers, strongly suggesting that it achieves acceptable reliability as well.
III. Study Design
This study was designed to:
(1) gather data to assign officers’ decisions to the four cells of the decision matrix illustrated in Figure 1, and to
(2) examine the accuracy of the SFST battery when used in the widely varying weather conditions of Colorado winter, spring, and summer months.
Both the design and the execution of the study focused on the integrity, completeness, and standardization of the data.
It is important to note how the study population was defined and how the sample of subjects was drawn. Subjects were a subset of the population of drivers who were detained by police officers during the study period. They were drivers, both those arrested and those released, who were stopped by police officers during the study period and who were requested to perform the SFSTs. The officers’ decisions about those drivers have been analyzed in terms of correct decisions (Correct Arrests and Correct Releases) and errors (Incorrect Arrests and Incorrect Releases).
In a broader context, the terms Correct Releases and Incorrect Releases could be extended to motorists who were stopped but who were not asked to perform the SFSTs. In many of those cases, the release decisions were correct, but it is likely that some of there were impaired drivers who were released without ever being asked to perform the SFSTs. Those individuals and those decisions are of interest and would be included in an assessment of overall proficiency in DUI detection and arrest. In fact, the entire population of impaired drivers, only some of whom are detected and stopped, is of interest in terms of traffic safety. In a validation study of SFSTs, however, the subjects were only those drivers who were asked to perform the tests.
VI. Summary and Discussion
In 1995, there is a sound base of scientific evidence to support the use of 0.10%, 0.08%, and 0.05% BACs as presumptive and per se alcohol limits for drivers. There also appears to be strong support for those statutes among citizens throughout broad (though not all) segments of society. A clear-cut shift of attitude over the past ten to fifteen years has resulted in anti-drunk driving sentiments by much of the driving population. In many social circles drinking-and-driving now is unacceptable behavior.
Why then, in a largely pro-alcohol enforcement climate, are there negative views of traffic officers’ related activities? Citizens often seem to believe that enforcement is hit-or-miss and that officers regularly fail to remove many, if not most, alcohol-impaired drivers from the roadway. Some also seem to believe that the activities at roadside are arbitrary and calculated to harass. Although the multifaceted social and individual variables that underlie this paradox of concurrent anti-enforcement sentiment and anti-drunk driving sentiment are beyond the scope of this report, it is germane to consider one set of factors. At least part of this view of alcohol enforcement is attributable to a general failure to recognize the importance of traffic officers’ duties, and to understand not only what their duties encompass but also the difficulty of their task.
Legislators, regulatory agencies, activities groups, and safety-conscious citizens alike sometimes appear to overlook the fact that traffic officers are pivotal in the deterrence of drunk driving. Unless officers are able to detect and arrest impaired drivers, those drivers will never enter the system of sanctions and, therefore, the existence of enabling statutes and anti-drunk driving sentiment will be largely irrelevant to them. Unfortunately, it is also true that the escape of detection and arrest on multiple occasions serves to reinforce the risky behavior. In effect, if no accident and no arrest occur on one or more occasions of drinking and driving, the citizen may conclude that driving after drinking is acceptable behavior on other occasions.
For a number of reasons, the difficulties associated with traffic officers’ alcohol-enforcement responsibilities typically are underestimated. One reason is the misnomer “drunk driving,” which suggests that their duty is to apprehend “drunks” or obviously-intoxicated individuals. If that were indeed the sole definition of alcohol enforcement duties, the task would be fairly straightforward. In reality, the risks associated with drinking and driving are not limited to obviously-intoxicated drivers, nor are officers’ enforcement responsibilities restricted to those drivers.
Traffic officers are responsible for removing alcohol-impaired drivers from the roadway, and the Colorado statute sets the criterion alcohol levels at 0.10% and 0.05% BAC. In other jurisdictions the BAC limit is 0.08%, with additional lower levels for lesser charges and specific driver groups. Enforcement problems arise in part from the fact that although the evidence clearly establishes that driving skills are impaired at 0.10% BAC and lower, many, possibly even most, individuals who are willing to drive after drinking are not obviously intoxicated at those levels.
Leaving aside the problem of detecting alcohol impairment by the observation of driving behaviors, consider officers’ task once they stop vehicles and contact drivers at roadside. Working under widely-varying conditions without special measurement apparatus, they must decide within a few minutes whether a specific driver is impaired by alcohol. Impaired drivers may or may not display atypical speech, appearance, or other personal characteristics, but in either circumstance the officers have no knowledge of any given driver’s sober appearance and behavior. The task is further complicated by the tolerant drinker’s normal appearance even at very high BACs.
Are there signs and symptoms which are reliably associated with 0.05% and 0.10%? With what level of confidence can the officer arrest or release a driver? With a decision criterion that minimizes incorrect arrests, the risk of releasing impaired drivers rises. On the other hand, a very strict decision criterion will decrease the number of impaired drivers who are released but at the risk of unnecessarily detaining non-impaired drivers. Is one risk preferable to the other? These questions define the context of traffic officers’ alcohol enforcement activities and the background of the Colorado Validation Study of the SFSTs.
The records collected and analyzed during this study provide evidence that the SFSTs, as used at roadside by trained and experienced law enforcement officers, are valid indices of the presence of alcohol.
Records of all driver contacts, which resulted in administration of the SFSTs during the study period, were entered into the analysis. Overall, for 234 cases confirmed by breath or blood tests, officers’ decisions to arrest and release were 86% correct, and 93% of their arrest decisions were correct.
It was not unexpected to find that officers were almost twice as likely to release incorrectly as to arrest incorrectly. Nonetheless, only 36% of the released drivers were at or above the statutory limit.
These findings obtained in the field with officers experienced with the use of SFSTs can be compared with findings from a laboratory setting with officers recently trained with the SFSTs. It should be kept in mind that the current data are not fully comparable to data from laboratory experiments, since there are differences other than time-since-training and laboratory vs. field. With that caution, the comparisons are instructive.
In an initial study of field sobriety tests with 238 laboratory subjects, officers’ decisions overall were 76% correct (Burns and Moskowitz, 1977). Only 54% of their arrest decisions were correct, and only 8% of their release decisions were incorrect. In a second laboratory study, officers’ decisions overall were 81% correct, their arrest decisions were 68% correct, and 14% of their release decisions were wrong (Tharp, Burns and Moskowitz, 1981). It is apparent that the arrest criterion was lower in the laboratory. The penalties for mistakes in a laboratory setting are, of course, fairly trivial compared to a real-world setting. The lower criterion, together with lack of experience with the tests, accounts for higher rates of incorrect arrests and lower rates of incorrect releases than found in this study. It is not surprising to find that officers in the field require more certainty about arresting a citizen and adopt a higher criterion with the result that they err in the direction of incorrect releases.
In summary, the data provide clear-cut findings about the use of SFSTs by officers in six Colorado communities. On a broader scale, they provide partial and tentative answers to some important questions. It is hoped that current data from a field setting will facilitate court proceedings with drivers arrested on DUI and DWAI charges. It is hoped, too, that the content of this report will add to the driving public’s understanding of roadside enforcement activities, as well as to recognition of police officers’ critical role in traffic safety.
THE USE OF FIELD SOBRIETY TESTS IN DRUNK DRIVING
November 9, 2000
2000-R-0873
THE USE OF FIELD SOBRIETY TESTS IN DRUNK DRIVING ENFORCEMENT
By: James J. Fazzalaro, Principal Research Analyst
You asked for a review of the use of field sobriety tests for drunk driving enforcement and, specifically, the so-called "California tests." You wanted to know the scientific basis used for giving the field sobriety test battery, how it is determined if someone passes or fails the tests, and what Connecticut cases allow this information to be used to remove a license.
SUMMARY
Until the mid 1970s, police departments around the country used many different types of field sobriety tests in enforcing drunk driving laws. There was little consistency or standardization in the tests being used. Concerned over this lack of consistency, the National Highway Traffic Safety Administration (NHTSA) initiated an effort to identify the best tests for enforcement use and standardize the way they were administered and scored. NHTSA sponsored a 1977 study in which researcher were asked to identify the tests being used throughout the country and recommend a "best" test battery for further development. Out of the dozens of different tests then in use, the researchers identified three-the walk-and-turn, one-leg-stand, and horizontal gaze nystagmus tests-as the most accurate, practical, and reliable tests for enforcement purposes. A subsequent 1981 study developed a standardized set of administration and scoring principles intended to promote consistency in the use of these tests. These three tests are now known as the Standardized Field Sobriety Test Battery and form the basis of a NHTSA training program for police officers.
The test battery is currently used in all states, but there are no mandatory requirements for use and many other field sobriety tests also remain in use. However, NHTSA maintains that only the three-test battery has been validated for accuracy and endorses no other tests as equally reliable.
The NHTSA training protocol requires police officers to follow the designated administration and scoring rules exactly or else the accuracy and validity of the tests are compromised. While the tests have wide acceptance in the drunk driving enforcement community, attorneys who specialize in drink driving cases, a number of researchers, and others have raised numerous issues and identified significant problems with both the scientific underpinnings and administration of field sobriety
tests. One of the most significant of these criticisms is the assertion that while the field tests have been developed solely for the purpose of assisting police officers in making drunk driving probable cause determinations in the field and are not capable of determining actual impairment, the courts frequently accept them as evidence for exactly the opposite reason for which they were created.
NHTSA accepts and endorses only its standardized three-test battery and discourages reliance on other nonvalidated field sobriety tests. The use of field sobriety tests is usually the last of three phases of information gathering in which police officers engage prior to making a drunk driving arrest decision. The first two phases of the pre-arrest process involve the observations officers make and the conclusions they draw while observing vehicle operation prior to stopping it and while interacting with the driver before he exits the vehicle. Observations made during all three contribute to the officer's determination of probable cause for arrest and have relevance in court.
In the NHTSA standardized test battery, each of the three tests is administered and scored separately. Each test has a specific number of scoring points or "clues" that determine how the suspect should be classified. If the suspect exhibits a designated number of these clues in a particular test, the NHTSA guidelines say that the person can be classified as likely to have a blood alcohol level above the .10% limit of most state drunk driving laws. For example, if a suspect exhibits two of eight possible scoring clues on the walk-and-turn test, the NHTSA guidelines state that there is a 68% probability that the person's blood alcohol level is above .10%. The probabilities for the other two tests detecting someone with illegal intoxication levels based on the scoring criteria are 65% for the one-leg-stand test and 77% for the horizontal gaze nystagmus test. NHTSA maintains that the identification probability for the walk-and-turn and nystagmus test combined is 80%.
Other than the horizontal gaze nystagmus test, field sobriety tests have generally been treated by Connecticut courts as nonscientific evidence that can be submitted to the jury for consideration as observations of a defendant's balance, coordination, and ability to follow directions to which it could apply its common knowledge. In 1995, the appellate court ruled that the horizontal gaze nystagmus test was, in fact, scientific evidence that required special foundation before being admissible (State v. Merritt). This concept was further developed in a 1998 decision (State v. Carlson). We found no case decisions that purport to deny the admissibility of evidence stemming from administration of other types of field sobriety tests and they appear to be generally acceptable in court as part of a fabric of observations a police officer makes that juries are deemed capable of weighing within their common knowledge. A 1998
decision (State v. Gracia) specifically rejected the contention that field sobriety tests other than the horizontal gaze nystagmus test should be considered scientific evidence subject to special conditions for admission.
A BRIEF HISTORY OF FIELD SOBRIETY TESTS
The "scientific" basis on which rests most of the credibility for use of field sobriety tests in drunk driving enforcement consists mainly of two NHTSA-sponsored studies conducted in 1977 and 1981, and several follow up research projects intended to validate the tests using data gathered in the field.
Initial Field Sobriety Test Research (1977)
Until approximately the mid-1970s, there was very little consistency among police department practices in selecting and administering field tests they used during drunk driving enforcement. Different police agencies used different tests and administered and interpreted them differently. The Los Angeles Police Department was among the first to use field tests in the enforcement and arrest process so they generally became known as the "California" tests in the law enforcement community. Because of the inconsistencies exhibited in the selection and administration of field sobriety tests and the existence of little or no scientific evidence of their validity or effectiveness, NHTSA began to take an interest in identifying the best tests police officers could use at the roadside. In 1977, NHTSA awarded a contract to three researchers at the Southern California Research Institute in Los Angeles, California to study the problem of police identification of drunk or alcohol-impaired drivers. The study contract ran until March 1981.
The grant required the researchers to examine the various field sobriety tests then in use throughout the country and determine a clinical relationship between the performed test and alcohol impairment. They had to establish a direct link between alcohol impairment and the specific test failure.
Beginning in 1975, the researchers rode with police officers in a number of states and from the many types of field tests being conducted they developed a list of about 16 tests they felt were feasible as potential sobriety tests. Following a small group pilot test of all the tests, the researchers narrowed the list to six tests that would be the subject of the 1977 NHTSA study, along with four alternate tests. The selected tests were evaluated in laboratory experiments using 238 test subjects and 10 police officers who evaluated the subjects using the tests and had to decide whether they should be arrested or released had the tests been
performed at roadside, assuming a legal threshold of .10% BAC as the basis for arrest.
The 1977 study had three stated objectives:
1. To evaluate currently used physical coordination tests to determine their relationship to intoxication and impairment
2. To develop more sensitive tests that would provide more reliable evidence of impairment, and
3. To standardize the tests and observations and thus given police more consistent evidence for use in court.
(M. Burns & H. Moskowitz, Psychophysical Tests for DWI Arrest, DOT-HS-5-01242, January 1977)
The six selected tests evaluated in the study are explained below.
· One Leg Stand-The subject must stand with heels together with arms at his sides, raise one leg about 6 inches off the ground, and hold that position for 30 seconds without swaying, using his arms for balance, or putting the foot down.
· Walk-and-Turn-The subject must walk nine steps heel-to-toe in a straight line, turn by pivoting on his left foot, and walk nine heel-to-toe steps back without swaying, stopping, stumbling, using his arms for balance, taking too few or too many steps, or walking in other than a straight line.
· Finger-to-Nose-The subject must stand erect with closed eyes, head tipped back, and hands extended horizontally. He then must touch the tip of the index finger to the tip of the nose, using both the left and right hand as the officer instructs.
· Finger Count-The subject must touch and count each finger in succession counting "1-2-3-4-5, 5-4-3-2-1" out loud.
· Horizontal Gaze Nystagmus (HGN)-The subject must follow the movement of a small light or object without moving his head. The officer looks for jerking of the eyes or "nystagmus" when the moving object is at an angle of 45 degrees or less. Besides determining the angle at which nystagmus begins, the officer also must observe and evaluate any breakdown in smooth eye pursuit of the target and the distinctiveness of the nystagmus at the point at which the eye has moved as far to the side as it will go.
· Finger Tracing-The subject traces a defined figure with his finger and the police officer observes any deviation.
The alternate tests that also were examined in the 1977 study included the Romberg Balance (feet together, arms at sides, eyes closed, and head tilted backwards while the officer observes for body sway), subtraction, counting backward, and letter cancellation tests.
Subjects were all alcohol consumers and were instructed not to eat for four hours prior to the experiments. They were given measured doses of alcohol such that they would have BACs ranging from 0 to .15%, but the tests subjects did not know the amount of the dose each received. Officers had to administer the test package and determine if the person should likely be arrested for having a BAC at or above .10%.
The researchers in the 1977 study concluded that all of the field sobriety tests examined were "alcohol sensitive," but that the walk-and-turn, one-leg-stand, and horizontal gaze nystagmus tests were the most effective at correlating with BACs of .10% or more. They considered these the best tests for further development and validation.
Some of the most significant conclusions the researchers drew are summarized below.
· While all of the tests examined were found to be "alcohol sensitive", that is, performance was affected by alcohol consumption to some degree, they were not all equally accurate.
· The arrest/release decisions made by the police officers were correct for 74% of the test participants with the high rate of false arrest decisions due, in the researchers opinions to the officers adopting a lower level of impairment as a decision criterion than would typically be applied in the field.
· An alternate method of interpreting the subjects' test results using a linear regression statistical technique yielded an 83% correct classification figure.
· The one-leg-stand, walk-and-turn, and HGN tests were considered to be the most accurate and reliable and were recommended for further evaluation as a standardized test battery.
· The HGN test was the most reliable of the three tests with a correlation coefficient of 0.68, compared to 0.55 for the walk-and-turn test and 0.48 for the one-leg-stand test. The combined correlation coefficient for the three-test battery was 0.702. (In
effect, the higher this number is within a range of 0 to 1.0, the more the test elements correlated with identifying subjects with the target BAC of .10% or more).
· If balance and walking skills are examined and the eyes are checked for the jerking nystagmus movement, the officer will have as much information about intoxication level as can be obtained at roadside.
Developing the Standardized Sobriety Field Test Battery (1981)
NHTSA subsequently awarded the Southern California Research Institute researchers a second contract to evaluate only the walk-and-turn, one-leg-stand, and HGN tests as a standardized test battery. The study objectives were to: (1) standardize the administration and scoring procedures for the three-test battery; (2) determine the reliability and validity of the standardized test battery in the laboratory; and (3) assess its feasibility, utility, and validity in the field. (V. Tharp, M. Burns & H. Moskowitz, Development and Field Test of Psychophysical Tests for DWI Arrest, DOT-HS-8-01970, March 1981).
The 1981 study essentially followed the same laboratory test procedure as the 1977 study except that it was limited entirely to these three tests. There were 297 test subjects who were given alcohol doses resulting in BAC levels of 0 to .18%. The researchers standardized the administration guidelines, test instructions, test demonstrations, and scoring criteria with 25 pilot test subjects.
The researchers reported that, on average, the police officers' estimates of the BACs of the people they tested differed by .03% from their actual measured BACs. The officers were able to classify 81% of the test subjects with respect to whether their BACs were above or below the .10% level.
The researchers also conducted a limited three-month field evaluation which resulted in incomplete data to reach any conclusions, but the researchers felt that trends in the field test suggested "positive results will be obtained if the test battery is widely used." They concluded that no further research was necessary to standardize the tests but a more comprehensive field evaluation was necessary and future research should take into account police attitude and motivation, an adequate timeframe for data collection, and numerous issues involved in obtaining law enforcement cooperation for such an effort.
Validating the SFST Battery (1995)
Although there have been several studies attempting to validate the SFST battery under field conditions, the one that is most frequently cited in the literature by those on both sides of the drunk driving enforcement issue is the 1995 Colorado validation study. Funded by NHTSA, the study was conducted for the Colorado Department of Transportation and, once again, the principal researcher was Dr. Marcelline Burns of the Southern California Research Institute. In her introduction to the final report, Dr. Burns makes two notable observations about the previous research that developed the SFTB. First, she notes that it "is clearly relevant" to ask if the methods used in the experiments were scientifically sound, but it should be recognized that the results "are now only indirectly enlightening about current roadside use of the tests." She notes further that controlled laboratory conditions are less variable and therefore "may be less challenging" than the highly varied conditions usually encountered in the field.
Dr. Burns second point about her prior research is that police officer experience with the SFSB is "key to the skill and confidence with which they use them as a basis for their decisions." She observes that the officers who participated in the 1977 and 1981 studies had not been trained in administering and scoring the tests until just before the experiments. Thus they had no time or opportunity to gain skill and confidence in the tests. Since a number of years have passed with police officers gaining experience in using the test battery, she believes it is reasonable to "expect that their decisions based on use of the tests would be more accurate that the officers used in the original research." (M. Burns, A Colorado Validation Study of the Standardized Field Sobriety Test (SFST) Battery, Final Report Submitted to the Colorado Department of Transportation, November 1995, p.1).
She identified the essential question to be examined in the study to be "How accurate are the arrest decisions which are made by experienced, skilled officers under roadside conditions when they rely on SFSTs?" She noted that a broadly applicable answer to this question could not be found in laboratory research and, instead, required field data that provides information about real world arrest decisions made by officers trained under the NHTSA guidelines for administering the test battery.
Volunteers from seven Colorado police agencies submitted records from every administration of the SFST battery over a five-month period. This produced 305 records for evaluation. A significant majority of the records produced for the study were provided in the first two month of the five-month period. The evaluation ultimately considered the correctness of only 234 of the 305 records since only cases for which a BAC was determined by a breath or blood specimen were considered. A subject's BAC was unknown if he was released when no observer was present, or if
an arrested driver refused to provide a specimen (p.11). Dr. Burns notes that breath specimens were obtained "either with instruments approved for evidential tests or with PBTs at roadside (p.13). (PBTs are preliminary breath test devices which are used prior to arrest in some states, but are criticized by some as not reliably accurate.)
The study concluded that for the 234 subjects who provided BAC samples, the police officers decisions to arrest or release were correct in 86% of the cases. Decisions to arrest were correct in 93% of the sample used and decisions to release were correct in 64% of the sample. (It should be noted that the Colorado study included BACs down to .05% in the arrest category since Colorado law at the time defined impaired driving as a BAC of .05% to .099%.)
Criticisms of the Field Sobriety Test Research
Manuals for defense attorneys raise a number of points regarding alleged weaknesses in the research supporting field sobriety tests generally and the SFST battery specifically. These manuals also assert that many subjective factors may intrude on objective administration of the field tests. The manuals cite NHTSA statements in its training documents to the effect that deviation from the standardized procedures for administering and scoring the tests detrimentally affects their accuracy. Among the other factors the manuals identify include the physical conditions of the testing environment, the particular characteristics of the individual, the pressures placed on the individual, the unusual nature of the tests themselves, and the possibility of a police officer's individual predisposition towards arrest affecting his interpretation of driver behavior (Richard Erwin, Defense of Drunk Driving Cases, Chapter 10; Lawrence Taylor, Drunk Driving Defense, Fifth Ed., Chapter 4; John O'Brien, Defending DWI Cases in Connecticut, Second Edition, Section B; Phillip Price, Jr., Field Sobriety Testing, Instructional Material, National College for DUI Defense, Harvard University, July 1996). Other significant research criticizes the SFTB research and attacks their use at trail as a basis for probable cause (Nowaczyk & Cole, Separating Myth from Fact: A Review of Research on Field Sobriety Tests, Champion, Aug. 1995; Simpson, Attacking NHTSA's Three-Test Field Sobriety Assessment, 5 DWI J.: L & Sci 9, 1988; Compton, Pilot Test of Selected DWI Detection Procedures for Use in Sobriety Checkpoints, DOT-HS-806-724)).
Erwin discusses these perceived weaknesses in the research at length in his treatise and some of his major criticisms are briefly summarized below. One of Erwin's major points with respect to the use of field sobriety tests is the apparent contradiction between what they were developed for and how they are admitted by many courts. He states that the primary purpose for developing the SFST battery was to assist the
police officer in making an arrest decision. The tests were correlated with their ability to determine whether a subject's BAC was at least .10% or below .10%. They were not correlated directly with driving impairment nor are they capable of determining if a person's driving ability is actually impaired. To a significant degree, neither the researchers who have conducted most of the seminal research on field sobriety tests or NHTSA itself appear to disagree substantively with this assessment. A recent report on validation of the SFST battery at BACs below .10% states,
"Driving a motor vehicle is a very complex activity that involves a wide variety of tasks and operator capabilities. It is unlikely that complex human performance, such as that required to safely drive an automobile, can be measured at roadside. The constraints imposed by roadside testing conditions were recognized by the developers of NHTSA's SFST battery. As a consequence, they pursued the development of tests that would provide statistically valid and reliable indications of a driver's BAC rather than indications of driving impairment. The link between BAC and driving impairment is a separate issue, involving entirely different research methods. ..." (J. Stuster & M. Burns, Validation of the Standardized Field Sobriety Test Battery at BACs Below 0.10 Percent, Anacapa Sciences, Inc. NHTSA, August 1998, p. 28.)
Erwin states that courts have usually admitted field sobriety test results as evidence of impairment, but not as evidence of a specific BAC, and usually not even as evidence of whether someone's BAC is above a certain level. This, he feels, leads to the apparent contradiction that the courts will not accept the SFST battery for the purpose for which they were developed and the method by which they were validated, but will accept them for purposes for which they have not been directly studied or validated (Erwin, Defense of Drunk Driving Cases, Sec. 10.09(6)).
Some of the other major criticisms in the literature are summarized below. We have presented them as propounded by the critics, but note that counterpoints to these assertions have been made in the literature as well.
· The 1977 study indicates that 47% of the subjects who would have been arrested based on the test battery had BACs less than .10% and that this false positive rate only decreased slightly to 32% in the subsequent 1981 study. Erwin implies that either of these percentages is unacceptably high. He cites a suggestion advanced in by Nowaczyk and Cole that this improvement may have been a bias introduced in the latter study when fewer test
subjects were selected to have BACs near the critical .10% level (22% in the 1981 study compared to almost 33% in the 1977 study) coupled with the easier task of identifying subjects with much higher or much lower BACs (Erwin, Sec. 10-09(6) citing Nowaczyk & Cole, Separating Myth From Fact: A Review of Research on the Field Sobriety Tests, Champion, August 1995, p. 40).
· Test subjects in the original studies were not adequately screened for the presence of drugs which could have affected the behaviors the police officers were observing, particularly with respect to the mistakes made in categorizing test subjects with no or moderate BACs as arrest candidates.
· The test results did not reproduce themselves well and thus are not as scientifically reliable as the researchers claimed. Critics, such as Nowaczyk and Cole, assert that to be considered scientifically reliable, tests should show a reliability coefficient in the high .80s to .90s. (A coefficient at or close to 0 would indicate no reliability or consistency in the test results while one close to 1.0 indicates a very high degree of reliability.) They assert that the test-retest portion of the 1977 study, in which 100 of the original test subjects were brought back for retesting two weeks later by the same officers, yielded a reliability coefficient of only 0.77 which they state indicates that 23% of the variability in test results is due to scoring errors. When the same subjects were tested at the same doses by different officers, the reliability coefficient dropped to 0.57. In the 1981 study, the reliability correlations ranged from .60 to .80.
· The correlation coefficients of the three tests were not sufficiently high to establish them as scientifically valid methods for determining BACs.
· The research developing and standardizing the SFST battery does not establish a baseline level of performance for the test maneuvers that accounts for differences in age, gender, physical stature and condition, and coordination. Critics also assert that the test subject pool in the 1977 and 1981 research was too heavily dominated by males and persons between 21 and 35 years old to be considered reliable in determining what typical test performance should be in the entire population.
· Much of the significantly lower rate of false positives found in the 1995 Colorado validation study (7.4% compared to 47% in the 1977 study and 32% in the 1981 study) can be explained by the
lower BAC arrest criterion of .05% that was necessary under the Colorado law than to training and experience factors associated with the participating police officers.
THE PRE-ARREST ENFORCEMENT PROCESS AND THE ROLE OF FIELD SOBRIETY TESTS
The enforcement process that typically leads up to a drunk driving arrest can generally be separated into three fairly distinct phases. The NHTSA, which establishes training and certification standards for training police officers in drunk driving enforcement identifies them in its training manuals as actions taken by police officers (1) while the vehicle is in motion, (2) during the initial personal contact with the presumed suspect, and (3) the pre-arrest screening process. Administration of field sobriety tests is the main component of this third phase. All three phases generally have the same objective, e.g., to provide the enforcement officer with a basis for determining whether there is probable cause to arrest the suspect for driving under the influence of alcohol.
The NHTSA manual states that each phase represents a set of actions and observations that should be used by the officer to answer three questions. These are:
1. Should I stop the vehicle?
2. Should the driver exit?
3. Is there probable cause to arrest the suspect for DWI?
(DWI Detection and Standardized Field Sobriety Testing, Student Manual, NHTSA Report No. HS 178 R10/95 (1995), Sec. IV-3, Exhibit 4-2)
The manual states that all of the information gathered in these phases is supposed to both assist the officer in the decision making process and gather and accumulate evidence in a form that can be most effectively utilized in court.
Phase I-The Vehicle in Motion
Except when drunk driving enforcement occurs through established sobriety checkpoints or at an accident scene, the first interaction with a police officer occurs when things about a particular vehicle draw the officer's attention and indicate to him that the vehicle should be stopped and investigated. Sometimes this may be unrelated to the driver's actions, such as when there is an obvious equipment defect or an expired registration or inspection sticker. But NHTSA has identified a
number of visual driving cues that it recommends police officers use to associate with alcohol-impaired driving. Because this material is widely distributed to police agencies and included in the recommended NHTSA training program, it generally has become the initial basis upon which they begin to establish probable cause in drunk driving enforcement.
This material was first published in 1981 as Visual Detection of Driving While Intoxicated-An Explanation of the DWI Detection Guide (DOT-HS-805711). It listed 20 driving cues that NHTSA believe its research showed were the best ones for discriminating night-time drunk drivers (.10 BAC or more) from night-time sober drivers. The cues were based on field studies where 4,600 patrol stops were correlated with BAC measurements. NHTSA maintained that the 20 cues could be associated with 90% of all drunk driving detections. The detection guide also assigned a probability to each of the cues purporting to indicate the relative probability that a driver exhibiting the cue was driving with a BAC of .10% or more. But NHTSA cautioned that the probability values were intended primarily to emphasize the relative importance of a particular cue and did not endorse using them when testifying in court.
The probability values ranged from 65% for turning with a wide radius and straddling a center or lane marker line to 30% for driving with headlights turned off or rapidly accelerating or decelerating. Seven of the 20 cues indicated a probability of more than 50%, four indicated a 50% probability, and the remaining nine a probability of less than 50%. But NHTSA also maintained that when more than one cue was observed, the officer should add 10 to the highest probability of an observed cue. For example, observing a driver weaving within a lane or between lanes (50%) and showing too slow a response to a traffic signal (40%) should be interpreted as a 60% probability that the driver had a BAC of .10% or more. Thus the highest probability that could be inferred through these cues was 75%, but NHTSA also asserted that police could use this system for predicting BACs of .05% by adding 15 to the cue's probability value.
NHTSA reissued its visual detection guide in 1998 based on additional field studies it commissioned, ostensibly for the purpose of adapting the guide for BACs down to .08%. It added four additional cues, some of which describe behaviors that could only be observed after the vehicle has been stopped or signaled to stop, revised some of the probability percentages, and included an additional set of post-stop cues that could be used when observing the driver's behavior once the vehicle was stopped.
The new guide is slightly more difficult to interpret than the 1981 version in that it does not list the cues and their probability rating individually.
Instead it groups them into four categories and specifies the range of probabilities within the category. The cue groupings are explained below.
Problems Maintaining Proper Lane Position-50%/75%
Weaving within lane, weaving across lane lines, straddling a lane line, swerving, turning with a wide radius, drifting, or almost striking a vehicle or other object.
Speed and Braking Problems-45%/70%
Stopping problems (too far, too short, or too jerky), accelerating or decelerating for no apparent reason, varying speed, or slow speed (10 mph or more under the speed limit.
Vigilance Problems-55%/65%
Driving in opposing lanes or wrong way on one-way road, slow response to traffic signals, slow or failed response to officer's signals, stopping in lane for no apparent reason, driving without headlights at night, or failure to signal a turn or lane change or signaling that is inconsistent with the action taken.
Judgment Problems-35%/90%
Following too closely, improper or unsafe lane change, illegal or improper turn (too fast, jerky, sharp, etc.), driving on other that the designated roadway, stopping inappropriately in response to officer, inappropriate or unusual behavior (throwing objects, arguing, etc.), appearing to be impaired (slouching, staring straight ahead with eyes fixed, tightly gripping the steering wheel, face close to the windshield, other indicators of appearance consistent with impairment.)
Post Stop Cues-85%
Difficulty with motor vehicle controls; difficulty exiting vehicle; fumbling with driver's license or registration; repeating questions or comments; swaying, unsteadiness, or balance problems; leaning on the vehicle or other object; slurred speech; slow response to officer or necessity for officer to repeat questions; providing incorrect information or changing answers; odor of alcohol.
The reissued detection guide explains the interrelationship of the individual cues differently. It states that if a driver is observed weaving in a lane or across lane lines, there is a 50% probability of a BAC of .08% or more, but if either weaving cue is observed with any other cue, the
probability becomes 65%. Observing two cues other than weaving indicates a probability of at least 50%, although some cues such as swerving, accelerating for no apparent reason, or driving on other than the designated roadway have single-cue probabilities of more than 70%.
Phase II-Personal Interaction with the Driver
The second phase of enforcement is the police officer's face-to-face driver observations and interview and, if the process proceeds further, observations of how the driver exits the vehicle and responds to the officer's directions. Sometimes, the officer may use pre-exit tests aimed at testing the driver's divided attention function or physical condition. This phase of the enforcement process is somewhat less defined procedurally and individualized to the particular officer or department policy. Nevertheless, the general thrust of the encounter is for the officer to elicit responses from the suspect and make observations as to his appearance, demeanor, speech, and attitude that the officer can use to decide on further actions. The NHTSA student training manual states that the driver interview provides the first definite indications that the driver is under the influence (Sec. VI-2). Frequently, the officer will ask the suspect at this point if he has been drinking.
The NHTSA training manual recommends that officers ask certain types of questions that can serve as simple divided attention tests. These can be of three types, specifically: (1) asking for two things simultaneously such as a license and registration, (2) asking interrupting or distracting questions, or (3) asking unusual questions. (Sec. VI-4, -5) In the case of asking for two things simultaneously, NHTSA training procedures instruct the officer to be observant as a possible sign of intoxication if a driver fails to produce both documents; produces other than the requested documents; fails to see the documents while searching in a wallet or purse; fumbles with or drops a wallet, purse, or the requested documents; or is unable to retrieve the documents using the fingertips.
With the second technique, the officer might ask the driver to produce his license and registration and while he is doing this ask him some unrelated question such as the correct time. NHTSA training procedures instruct the officer to be alert to a driver who ignores the question and concentrates only on the initial task of retrieving the documents, forgets to resume the document search after answering the question, or supplies a grossly incorrect answer to the question.
The third technique of asking unusual questions is employed after the driver has retrieved his license and registration. For example, while holding the license the officer might ask the driver for his middle name. The manual states that if he is not expecting to have to process this
information and is impaired, he may have difficulty responding to the unusual question and answer what would be a usual question he is prepared to answer, such as his first name.
The final stage in this phase, if it progresses further, is the vehicle exit sequence. During this phase, the NHTSA training manual instructs the officer to be alert for a driver who shows angry or "unusual" reactions, cannot follow instructions, cannot open the door, leaves the vehicle in gear, "climbs" out of the vehicle, leans against the vehicle, or puts his hands on the vehicle for balance § VI-6).
Phase III-Pre-arrest Screening and Administration of Field Sobriety Tests
This final phase of establishing a basis of probable cause for arrest involves administration of the structured field sobriety tests. In some jurisdictions that allow for them, this can also include administration of a preliminary breath test.
As indicated earlier in this report, NHTSA has developed and promotes the use of the Standardized Field Sobriety Test battery consisting of the Walk-and-Turn (WAT), One-Leg-Stand (OLS), and Horizontal Gaze Nystagmus (HGN) tests. NHTSA recognizes only these tests in its training protocols and does not endorse the use of any other types of field sobriety tests and similarly validated. It also makes it clear that the validity of the test battery depends on strict adherence to the designated administration and scoring principles it has developed. If they are followed exactly, NHTSA asserts that the HGN test is 77% reliable in identifying those with BACs of .10% or more, the WAT test is 68% accurate, and the OLS test is 65% accurate. The HGN test combined with the WAT test is claimed to have 80% reliability. If the procedures are not followed exactly, NHTSA states that "the decision making guidelines will not be accurate."
Failure to pass any of the three tests is determined by counting specific scoring clues NHTSA specifies for each test. Presence of a predetermined number of clues indicates failure to perform the test.
Each of the three tests in the SFST battery is briefly described below, along with the administrative steps that must be followed and the scoring clues applicable to each test. The actual descriptions in the NHTSA manual are considerable more extensive. In addition, the standardized procedures for each test generally require that the officer provide clear and specific directions and demonstrate what the subject must do. Failure to do so invalidates the test effectiveness. The tests
must be administered outside the vehicle in a well-lighted area suitable for walking and standing and safe from traffic.
The Walk-and-Turn (WAT) Test
The test has two distinct parts. The first part (instruction phase) requires the subject to balance heel-to-toe while the officer gives the instructions and demonstrates the test. The second part of the test requires the subject to take nine heel-to-toe steps on a straight line, pivot around, and take nine heel-to-toe steps back.
Test Conditions. The required test conditions are level ground, a hard, dry, non-slippery surface, and conditions under which the suspect is in no danger should he fall. The student training manual states that the test criteria are not necessarily valid for people age 65 or older or people with leg injuries or inner ear disorders. (Prior editions of the manual stated this limitation as applicable to people more than 60 years of age, more than 50 pounds overweight, or with physical impairments that affect balancing ability. The reason for the change does not appear in the manual.) Suspects with heels more than two inches high must be given the chance to remove their shoes. The WAT test requires a line that the suspect can see and follow. If a natural line is not present, the officer must draw one in the dirt or on a sidewalk with chalk. Walking parallel to a curb is not acceptable. The suspect must be able to see to perform the test. His eyes must be open and adequate light available. The manual states that if the officer can see the suspect clearly the lighting is adequate, otherwise the officer must use a flashlight to illuminate the line. A person who cannot see out of one eye may have difficulty performing the test because of poor depth perception. The suspect must watch his feet because this makes the test more difficult for an intoxicated person. The officer must observe the suspect performing the test from three to four feet away and remain motionless. Standing too close or moving while the test is going on makes it more difficult even for a sober person to perform the test.
Standardized Test Procedures. The WAT test must be administered as follows.
· Instruct the subject to place the left foot on the line and the right foot heel-to-toe in front of it (demonstrate).
· Verify that the suspect understands that the stance must be maintained while the instructions are given.
· If the suspect breaks from the stance during the instructions, stop the instructions until the stance is resumed.
· Tell the suspect that he will be required to take nine heel-to-toe steps down the line, turn around, and take nine steps back down the line but not to begin until instructed.
· Demonstrate two or three heel-to-toe steps and the turn.
· Instruct the suspect to keep both arms at his sides, watch his feet, count the steps out loud, and not to stop walking until the test is completed.
· Ask if the suspect understands the directions and, if not, repeat whatever he does not understand but not the entire set of directions.
· Tell the suspect to begin and to count his first step from the heel-to-toe position as one.
· If the suspect staggers, steps off the line, or stops while walking, allow him to resume from the point of interruption. Do not have him repeat the test from the beginning. (The manual states that the test loses its sensitivity if it is repeated.)
Standardized Scoring Clues. The WAT test procedure has eight specific scoring clues the officer must track. The clues must be scored if the suspect:
· Loses balance during the instructions (his feet break from the heel-to-toe stance)
· Starts walking before the instructions are completed and he is instructed to start.
· Stops while walking to steady himself (but do not score this clue if he is only walking slowly).
· Leaves more than one-half inch between his feet during any heel-to-toe step.
· Steps off the line (if this occurs three times the test is terminated and the officer must score it as if all eight clues were shown).
· Raises one or both arms more than six inches from his side to maintain balance.
· Turns improperly either by removing the front foot from the line while turning, removes both feet from the line, or clearly does not follow the directions as demonstrated.
· Takes the wrong number of steps in either direction.
If the suspect cannot do the test, the officer must score it as if all eight clues were present.
If the suspect clearly exhibits two or more of the eight clues or cannot complete the test, the officer must classify his BAC as above .10%. Officers are instructed to note in their report how many times each clue appears, but count it only once for scoring purposes.
The One-Leg-Stand (OLS) Test
The OLS test requires a suspect to stand with his arms at his side and raise and hold one leg at least six inches off the ground for 30 seconds. He must count the seconds out loud according to specific instructions. The 30-second time period is important to the test since NHTSA research indicates that it makes the test sensitive to people in the .10% to .15% BAC range who might otherwise pass the test if they only had to maintain the position for less time. NHTSA research has shown that someone with a BAC above .10% can maintain balance for up to 25 seconds but seldom for 30 seconds.
Test Conditions. The conditions required for the OLS test are like those for the WAT test. There must be light adequate to provide a visual frame of reference. The officer must observe motionless from three to four feet away for the same reasons as for the WAT test. The test criteria are not necessarily valid for people age 65 or older, people 50 pounds or more overweight, or people with leg injuries or inner ear disorders.
Standardized Test Procedures. The NHTSA specified test procedures for the OLS test are as follows.
· Instruct subject to stand with feet together and arms down at sides (demonstrate).
· Tell subject not to start until told.
· Ask if subject understands instructions.
· Explain to the subject that when told to start he must raise one leg, either his left or right, approximately six inches off the ground with the toe pointed out (demonstrate stance).
· Tell the subject he must keep both legs straight with his arms at his side and, while holding the position count out loud for 30 seconds saying "one thousand and one, one thousand and two, etc." until told to stop (Demonstrate the counting method).
· Remind the subject he must keep both arms at his sides at all times throughout the test and keep watching his raised foot.
· Ask if he understands and get a confirmation of his understanding.
· Tell him to begin the test.
· Observe the subject from three feet away and remain "as motionless as possible." If he puts his foot down, instruct him to pick it up again and resume counting from the point it touched the ground. If he counts very slowly, end the test after 30 seconds. If he counts quickly, make him continue until told to stop.
Standardized Scoring Clues. The test is scored according to four scoring clues. If the suspect
· Swaying side-to-side or back-and-forth while maintaining the one-leg stance
· Moving arms six inches or more from the sides to maintain balance
· Hopping in order to maintain the one-leg stance
· Putting his foot down one or more times during the 30 seconds.
If the suspect cannot do the test or puts his foot down three or ore times, the officer must record the results as if all four clues were scored
Horizontal Gaze Nystagmus (HGN) Test
The HGN test is considered the most accurate of the three tests and NHTSA suggests that it be administered at a minimum if the suspect is unable to perform the other two tests due to age, size, or physical limitations. Some of the research on these tests suggests that when it is consistently given first in the test sequence, the reliance some police officers have on it might may have a subtle influence on his expectations and scoring of the other two tests (Anderson, Schweitz, and Snyder, Field Evaluation of a Behavioral Test Battery for DWI, DOT-HS-806-475, September 1983).
Nystagmus is involuntary jerking of the eye. Research shows that there are more than 40 types of eye nystagmus. The HGN test is designed to measure the type of nystagmus that occurs when the eyes gaze to the side. HGN will occur in any person's eyes when gazing extremely sideways, but NHTSA maintains that when a person is intoxicated there are these signs that become apparent in his eye movements: (1) the nystagmus occurs much sooner, that is, the less the persons eyes have to move before the jerking occurs; (2) if the person's eyes move as far to the side as possible, the greater the alcohol impairment, the more distinct the nystagmus will be at the extreme gaze position; and (3) an intoxicated person cannot follow a slowly moving object smoothly with his eyes. The HGN test is intended to identify and measure these three signs.
The key element of measuring HGN is correctly estimating when the eye has reached a deviation angle of 45 degrees. NHTSA maintains that when someone's BAC is above .10%, the jerking will begin before his eye has moved 45 degrees to the side. Officers trained with the NHTSA training procedure are provided a template for practicing how to estimate the 45 degree angle but they are not required to use a template when they administer the test in the field.
Test Conditions. The test requires the use of an object for the subject to follow. The NHTSA training manual says that this can be a fingertip, penlight, or pen. It must be held slightly above eye level and 12-15 inches away from the person's nose. The police officer must inquire and make note of whether or not the suspect if he is wearing contact lenses, but the lenses do not have to be removed for the test. However, a suspect wearing glasses must be made to remove them.
Standardized Test Procedure. The officer must administer the test following these procedures.
· The officer instructs the suspect that he is going to check his eyes, that he must keep his head still and follow the object only with his eyes, and that he must focus on the object until told to stop.
· The officer must hold the stimulus 12-15 inches from the suspect's nose and slightly above eye level. He must move the stimulus smoothly across the suspect's entire field of vision and check to see if the eyes are tracking together or one lags behind the other. (If the eyes do not track together, it could be a sign of a medical disorder, injury, or blindness.)
· The officer next must check to see that both pupils are the same size (if not, it could be a sign of a head injury).
· The officer starts with the left eye and smoothly moves the stimulus to the right at a speed such that it takes about two seconds to being the person's eye as far to the side as it can go. He then moves the stimulus similarly to the left to check the person's right eye.
· Using this process, the officer must check for all three clues in both eyes, always starting with the left. He must check at least twice for each clue in each eye.
· The officer must check for the clues in this sequence: lack of smooth pursuit, nystagmus at maximum deviation, and onset of nytagmus prior to 45 degrees.
· When checking for nystagmus at maximum deviation, the officer must move the stimulus to the side until no white is showing at the side of the suspect's eye and hold the position for four seconds.
· When checking for nystagmus onset angle, the officer must move the stimulus at a speed that would take about four seconds to reach the edge of the suspect's shoulder. Watch the eye for jerking and, when it occurs, stop and verify that is continues.
· The four-second speed of the stimulus movement is important. If the object moves too fast, the officer could go past the point of onset or miss it altogether.
· If the suspect's eyes start to jerk before 45 degrees, the officer must check to see that some white is still showing on the side of the eye closest to the ear. If no white shows, this means either that the officer has taken the eye too far to the side (more than 45 degrees) or the person has unusual eyes that do not deviate very far.
Standardized Clues. There are three scoring clues that are measured for each eye, giving a maximum of six scoring points should all three clues be present in both eyes. If four or more clues are observed, the NHTSA manual states the person should be classified with a BAC above .10%. The are the scoring clues.
· Lack of smooth pursuit (the eyes bounce or jerk as they follow the object)
· Distinct nystagmus at maximum deviation when held for four seconds. While some people exhibit jerking at maximum deviation even when sober, in an intoxicated person the jerking should be "very pronounced, and easily observable."
· Onset of nystagmus before the eye has moved 45 degrees.
These are the only three clues NHTSA recognizes as valid indicators of HGN. NHTSA specifically does not support the position that the exact onset angle can be used to estimate a person's specific BAC and considers this to be a misuse of the HNG test.
Combined HGN and WAT Test Scoring Matrix
NHTSA provides a special scoring matrix for officers to use when combining the results of the HGN and WAT tests. It notes that the HGN test requires four clues for classification as above .10% BAC while the WAT requires only two. The matrix can be used when the suspect scores higher on one test and lower on the other. For example, if the suspect scores three clues on the HGN test but only two clues on the WAT test, the matrix indicates that he should be classified as being above .10% BAC. But if he scores three clues on the HGN test and only one on the WAT test, the matrix shows that his BAC is probably below .10% BAC. The NHTSA manual does not link the OLS test with any other test for combined scoring purposes.
CASE LAW ESTABLISHING ADMISSIBILITY OF FIELD SOBRIETY TESTS
State of Florida v. Meador
We are providing information on this 1996 case from Florida because it is prominent in the literature on field sobriety testing as one of the most significant recent cases addressing the issue of how field sobriety tests are viewed in the courts. It is of particular significance because two of the leading recognized experts in the field with opposing points of view were called to testify as expert witnesses. The state used Dr. Marcelline Burns as its expert and the respondent used Dr. Spurgeon Cole as its expert. Dr. Burns is the researcher from the Southern California Research Institute who conducted the 1977 and 1981 NHTSA studies establishing and standardizing the SFST battery and participated in numerous subsequent studies to support its validity and accuracy. Dr. Cole is a clinical psychologist and professor at Clemson University who has co-authored several critical analytical reviews of field sobriety tests and the research supporting them as noted in the discussion above. The general interest in this case stems from the occasion for the court to
concurrently review the testimony of two of the most recognized experts on field sobriety testing.
State v. Meador (674 So.2d 826, 1996) involves an appeal by the state of a county trial court's pretrial order excluding the evidence of a field sobriety test battery that included the tests in the NHTSA SFST battery and some other tests not in the standardized battery. The Fourth District Court of Appeal exercised it its discretionary jurisdiction to review the issue to the "disparate approaches and conclusions" of county court judges within the district with respect to admissibility of the tests.
The case involved challenges by two defendants arrested for driving under the influence in different Florida towns. Both defendants had challenged the admissibility of the field sobriety test administered to them on the grounds that they lacked both scientific reliability and probative value.
In State v. Meador, the court noted that no Florida appellate court had yet ruled directly on the admissibility of field sobriety test results, but that in 1995 the Florida Supreme Court has ruled in State v. Taylor that a pre-arrest request made to a defendant to perform field sobriety tests after an investigative stop upon reasonable suspicion of DUI was reasonable (674 So. 2d 830).
In rendering its decision the court separated the HGN test from the other tests administered to test psychomotor functions. (The psychomotor tests administered to the defendants included the walk-and-turn, one-leg-stand, Romberg balance, and finger-to-nose tests. The court determined that testimony concerning performance on psychomotor field sobriety tests is sufficiently reliable as lay observations of intoxication to be relevant in proving impairment and the danger that they be unfairly prejudicial did not substantially outweigh their probative value so as to require exclusion as evidence. It considered them admissible as lay observations of the police officer with the proviso that characterization of the test results by witnesses be restricted so as to not elevate the significance of the test result evidence above other lay observations of intoxication. Specifically, the court cautioned that caution should be exercised to restrict use of terms such as "test," "pass," "fail," or "points" when referring to the results.
The court viewed the HGN test in a different light. It determined that HGN test results should not be admitted as lay observations of intoxication because HGN testing constitutes scientific evidence. Thus, although the evidence may be relevant, the court felt that the danger of unfair prejudice, confusion of issues, or misleading the jury requires
exclusion of the HGN test evidence unless the "traditional predicates of scientific evidence are satisfied." (Meador, p. 836).
Connecticut Case Decisions
State v. Lamme (216 Conn. 172, August 1990)
The defendant in this case challenged the admissibility of the results of two field sobriety tests administered to him after he was stopped for driving without lighted headlights at night. Previous to being stopped by the police officer, the defendant had been interviewed by a different police officer called by hotel management to the hotel where the defendant had consumed several drinks and fallen asleep in the lobby. The officer noticed the odor of alcohol on the defendant and when the defendant rejected an offer for arrangement of a ride home and said he would wait in his car for a friend to drive him home. When he observed the defendant walk to his car unsteadily, the officer radioed headquarters with a description of the defendant and his car. The second officer who subsequently stopped the individual heard the broadcast and drove to the vicinity of the hotel where he saw the defendant driving a car matching the description without the headlight illuminated.
The officer administered two field sobriety tests to the defendant-a walk-and-turn test and a finger-to-nose test. While the case decision provides no further description of the content of the tests, it is clear that it did not constitute the SFST battery. The decision states that "the defendant's failure to pass these tests was the basis for his arrest for driving while under the influence of intoxicating liquor." (p. 177)
Both the trial court and the Appellate Court had concluded earlier that the defendant was not entitled to suppress the evidence of the two field sobriety tests. The courts agreed that the police had legally stopped him initially for driving without headlights and, subsequently, the odor of alcohol on his breath provided a "reasonable and articulable suspicion" that he might be involved in criminal activity and justified further detention for the "limited intrusion" represented by the field sobriety tests at the place where he was being detained. The Supreme Court agreed that this constituted a valid stop under the requirements of the U.S. Supreme Court's decision in Terry v. Ohio (392 U.S. 1, 20-22, 88S. Ct. 1868).
In his appeal to the Supreme Court, the defendant asserted that article first, § nine of the Connecticut Constitution forbids the police to detain anyone, even on reasonable and articulable suspicion, unless and until the police have probable cause to make an arrest. This argument would require the court to rule the field sobriety test results inadmissible since
the police had conceded that they did not have probable cause to arrest him until after administering the field sobriety tests.
The Supreme Court rejected this argument and concluded that "the principles of fundamental fairness that are the hallmark of due process permit brief investigatory detention, even in the absence of probable cause, if the police have a reasonable and articulable suspicion that a person has committed or is about to commit a crime." (p.184). Thus the court concluded that the principles underlying constitutionally permissible stops enunciated by the U.S. Supreme Court in its Terry decision and subsequent relevant cases define when detentions are "clearly warranted by law" under article first, § nine of the state constitution.
State v. Merritt (36 Conn. App. 76)
This decision appears to be the first instance a Connecticut appellate court addressed the issue of whether the HGN test and its results are the type of scientific evidence requiring a special foundation for admission. The defendant was initially stopped by police after failing to stop for a stop sign and almost colliding with the car of the arresting officer. The officer suspected the defendant to be intoxicated based on his observation that the defendant's breath smelled of alcohol, his eyes were bloodshot, his clothes disheveled, he swayed back and forth, and he spoke slowly. The police officer conducted three field sobriety tests-alphabet recitation, a ten-step walk-and-turn test, and a one-leg-stand test. Although it is not clear from the case decision if the one-leg-stand test was performed in accordance with the procedures outlined in the SFST battery, the other two tests clearly were not part of the battery.
After concluding that the defendant had failed all three of the psychomotor tests, the police officer performed the HGN test in which he made "three separate observations" of the reactions of each of his eyes. On the basis of all his observations, including those from the HGN test, he took the defendant into custody, but, for several reasons, an evidentiary breath test could not be administered.
At trial, the defendant apparently objected to the admissibility of the results of the HGN test, but not to the admissibility of the other field sobriety tests that were administered. On appeal to the appellate court, the defendant challenged the admissibility of the HGN test results as constituting scientific evidence requiring foundation according to the Frye test of general acceptability within the scientific community. The appellate court noted that no similar court had yet ruled on whether the HGN test constituted scientific evidence requiring special foundation for admission.
After reviewing the plethora of cases on this subject from other jurisdictions, the court determined that the HGN test constituted such scientific evidence and since the state had not laid the foundation for evidence pursuant to the Frye standard, it ruled that the trial court has exceeded its discretion by admitting the HGN test results. However, the court also found that this constituted harmless error and upheld the lower court's conviction based on the conclusion that the jury's perceptions of all of the other evidence, including the defendant's admission of consumption of four drinks, his failure to pass the three other field sobriety tests, and his appearance and demeanor, was not so affected by the improperly admitted testimony on the HGN test that the likely trial result would have been different without the HGN testimony.
State v. Carlson (702 A. 2d 886, 45 Conn. Sup. 461 (1998))
This case further established the specific basis for accepting the HGN test as valid scientific evidence. The court ruled that for purposes of determining if the HGN test had gained general acceptance in the particular field in which it belonged (the essence of the Frye test for acceptability), the relevant scientific communities included optometry, neurology, behavioral psychology, highway safety, and forensic science. The court further found that the test was admissibility as scientific evidence since it was generally accepted in these relevant scientific communities as a reliable indicator of alcohol impairment, it had been the subject of extensive field and laboratory testing and scholarly reivew, national standards existed to guide police officers in executing the test, and it was sufficiently straightforward that a fact finder could reasonably and realistically draw its own conclusions from it. However, the court also reinforced the position that the fact that the HGN test satisfied the standards for admissibility as scientific evidence did not obviate the necessity of laying a proper foundation with a showing that the officer administering the test had the necessary qualifications and followed the appropriate procedures.
State v. Gracia (719 A. 2d 1196, 51 Conn. App. 4 (November 1998))
This case considered several points of law relative to drunk driving issues, but it appears significant with respect the issue of field sobriety test in that it appears to be the first Supreme Court decision specifically to rule on the admissibility of field sobriety tests other than the HGN test as scientific evidence The facts of the case involved a situation where a passing motorist encountered the defendant's vehicle in the left traffic lane of a local street with the engine running, the lights on, the right turn signal flashing, and the radio playing. He observed the defendant asleep in the vehicle and tried to waken him. When he could not do so, he left to call the police and, when he returned, observed the vehicle and
defendant in the same positions as when he left. He made other observations consistent with the idea that the vehicle was running and in gear with the defendant asleep behind the wheel.
When a police officer arrived, he attempted to waken the sleeping defendant for approximately five minutes before succeeding. The police officer testified that the defendant's eyes appeared glassy and bloodshot and that he detected the odor of alcohol. Following several other interactions, the officer asked the defendant to exit the vehicle and, following several additional observations relating to the defendant's condition and demeanor, the officer administered two field sobriety tests, which the decision identified as the one-leg-stand and the walk-and-turn tests.
The defendant raised a number of issues on appeal, one of which was that the judiciary was precluded from exercising jurisdiction in this case because the trial court's suspension of his license violated the separation of powers provision of the Connecticut Constitution. Among the issues raised was that the trial court improperly admitted evidence concerning the field sobriety test he was given in that these tests constitute scientific evidence requiring expert testimony prior to admission.
Before addressing this issue, the court noted that the defendant's claim that Miranda warnings were required before admisintration of field sobriety tests was unfounded because the U.S. Supreme Court had ruled in Pennsylvania v. Bruder (488 U.S. 9, 109 S. Ct. 205) that questioning at the scene and conducting field sobriety tests does not involve custody for Miranda purposes. The court further noted that its previous ruling in the Lamme case considered such testing "incident to the initial stop, based on the officer's reasonable suspicion, rather than on the subsequent arrest."
The court rejected the argument. It ruled that the Frye test for admissibility of scientific evidence did not apply to the field sobriety test administered in this case. It found that the two administered tests assessed the defendant's balance, coordination, and ability to follow directions and that they were neither highly technical nor required special skills or knowledge in order to be understood. The court referred to its previous decision in Merritt in which it noted that these types of tests, unlike the HGN test, were within the common knowledge of lay jurors. It also noted that the trial court instructed the jury that the tests were not scientific evidence and that it should consider the observations made during the tests and use its common experience in determining whether the defendant was intoxicated.
State v. Porter (241 Conn. 57, 698 A. 2d. 739 (1997))
While not specific to field sobriety tests, this decision adopted a new standard with respect to the basis for admitting scientific evidence. It replaced the Frye standard of general acceptance within the relevant scientific community with the standard elucidated in the U.S. Supreme Court's 1993 decision in Daubert v. Merrill Dow Pharmaceuticals. Instead of "general acceptance" within the relevant community, the new federal standard established in Daubert requires only that the reasoning or methodology underlying the scientific theory or technique is scientifically valid and can properly be applied to the facts at issue. "In other words,' the court stated, "before it can be admitted, the trial judge must find that the proffered evidence is both reliable and relevant.'" (Porter p. 64)
In Daubert, the court listed four nonexclusive factors for federal judges to consider in determining whether a particular theory or technique is based on scientific knowledge: (1) whether it can be, or has been, tested; (2) whether it has been subjected to peer review and publication; (3) the known or potential rate of error, including the existence and maintenance of standards controlling its operation; and (4) whether it is, in fact, generally accepted in the relevant scientific community. However, the court also noted that the process was a "flexible" one and that other factors may have merit to the extent that they focus on the reliability of evidence as ensured by the scientific validity of its underlying principles.
In adopting the Daubert criteria as a replacement for the Frye standard, the court further acknowledged the U.S. Supreme Court's recognition that even if a scientific theory or technique satisfied both the reliability and relevance criteria of Daubert, it could still be excluded under federal evidentiary rules if its probative value was substantially outweighed by the danger of unfair prejudice, confusion of issues, or misleading the jury.
2000-R-0873
THE USE OF FIELD SOBRIETY TESTS IN DRUNK DRIVING ENFORCEMENT
By: James J. Fazzalaro, Principal Research Analyst
You asked for a review of the use of field sobriety tests for drunk driving enforcement and, specifically, the so-called "California tests." You wanted to know the scientific basis used for giving the field sobriety test battery, how it is determined if someone passes or fails the tests, and what Connecticut cases allow this information to be used to remove a license.
SUMMARY
Until the mid 1970s, police departments around the country used many different types of field sobriety tests in enforcing drunk driving laws. There was little consistency or standardization in the tests being used. Concerned over this lack of consistency, the National Highway Traffic Safety Administration (NHTSA) initiated an effort to identify the best tests for enforcement use and standardize the way they were administered and scored. NHTSA sponsored a 1977 study in which researcher were asked to identify the tests being used throughout the country and recommend a "best" test battery for further development. Out of the dozens of different tests then in use, the researchers identified three-the walk-and-turn, one-leg-stand, and horizontal gaze nystagmus tests-as the most accurate, practical, and reliable tests for enforcement purposes. A subsequent 1981 study developed a standardized set of administration and scoring principles intended to promote consistency in the use of these tests. These three tests are now known as the Standardized Field Sobriety Test Battery and form the basis of a NHTSA training program for police officers.
The test battery is currently used in all states, but there are no mandatory requirements for use and many other field sobriety tests also remain in use. However, NHTSA maintains that only the three-test battery has been validated for accuracy and endorses no other tests as equally reliable.
The NHTSA training protocol requires police officers to follow the designated administration and scoring rules exactly or else the accuracy and validity of the tests are compromised. While the tests have wide acceptance in the drunk driving enforcement community, attorneys who specialize in drink driving cases, a number of researchers, and others have raised numerous issues and identified significant problems with both the scientific underpinnings and administration of field sobriety
tests. One of the most significant of these criticisms is the assertion that while the field tests have been developed solely for the purpose of assisting police officers in making drunk driving probable cause determinations in the field and are not capable of determining actual impairment, the courts frequently accept them as evidence for exactly the opposite reason for which they were created.
NHTSA accepts and endorses only its standardized three-test battery and discourages reliance on other nonvalidated field sobriety tests. The use of field sobriety tests is usually the last of three phases of information gathering in which police officers engage prior to making a drunk driving arrest decision. The first two phases of the pre-arrest process involve the observations officers make and the conclusions they draw while observing vehicle operation prior to stopping it and while interacting with the driver before he exits the vehicle. Observations made during all three contribute to the officer's determination of probable cause for arrest and have relevance in court.
In the NHTSA standardized test battery, each of the three tests is administered and scored separately. Each test has a specific number of scoring points or "clues" that determine how the suspect should be classified. If the suspect exhibits a designated number of these clues in a particular test, the NHTSA guidelines say that the person can be classified as likely to have a blood alcohol level above the .10% limit of most state drunk driving laws. For example, if a suspect exhibits two of eight possible scoring clues on the walk-and-turn test, the NHTSA guidelines state that there is a 68% probability that the person's blood alcohol level is above .10%. The probabilities for the other two tests detecting someone with illegal intoxication levels based on the scoring criteria are 65% for the one-leg-stand test and 77% for the horizontal gaze nystagmus test. NHTSA maintains that the identification probability for the walk-and-turn and nystagmus test combined is 80%.
Other than the horizontal gaze nystagmus test, field sobriety tests have generally been treated by Connecticut courts as nonscientific evidence that can be submitted to the jury for consideration as observations of a defendant's balance, coordination, and ability to follow directions to which it could apply its common knowledge. In 1995, the appellate court ruled that the horizontal gaze nystagmus test was, in fact, scientific evidence that required special foundation before being admissible (State v. Merritt). This concept was further developed in a 1998 decision (State v. Carlson). We found no case decisions that purport to deny the admissibility of evidence stemming from administration of other types of field sobriety tests and they appear to be generally acceptable in court as part of a fabric of observations a police officer makes that juries are deemed capable of weighing within their common knowledge. A 1998
decision (State v. Gracia) specifically rejected the contention that field sobriety tests other than the horizontal gaze nystagmus test should be considered scientific evidence subject to special conditions for admission.
A BRIEF HISTORY OF FIELD SOBRIETY TESTS
The "scientific" basis on which rests most of the credibility for use of field sobriety tests in drunk driving enforcement consists mainly of two NHTSA-sponsored studies conducted in 1977 and 1981, and several follow up research projects intended to validate the tests using data gathered in the field.
Initial Field Sobriety Test Research (1977)
Until approximately the mid-1970s, there was very little consistency among police department practices in selecting and administering field tests they used during drunk driving enforcement. Different police agencies used different tests and administered and interpreted them differently. The Los Angeles Police Department was among the first to use field tests in the enforcement and arrest process so they generally became known as the "California" tests in the law enforcement community. Because of the inconsistencies exhibited in the selection and administration of field sobriety tests and the existence of little or no scientific evidence of their validity or effectiveness, NHTSA began to take an interest in identifying the best tests police officers could use at the roadside. In 1977, NHTSA awarded a contract to three researchers at the Southern California Research Institute in Los Angeles, California to study the problem of police identification of drunk or alcohol-impaired drivers. The study contract ran until March 1981.
The grant required the researchers to examine the various field sobriety tests then in use throughout the country and determine a clinical relationship between the performed test and alcohol impairment. They had to establish a direct link between alcohol impairment and the specific test failure.
Beginning in 1975, the researchers rode with police officers in a number of states and from the many types of field tests being conducted they developed a list of about 16 tests they felt were feasible as potential sobriety tests. Following a small group pilot test of all the tests, the researchers narrowed the list to six tests that would be the subject of the 1977 NHTSA study, along with four alternate tests. The selected tests were evaluated in laboratory experiments using 238 test subjects and 10 police officers who evaluated the subjects using the tests and had to decide whether they should be arrested or released had the tests been
performed at roadside, assuming a legal threshold of .10% BAC as the basis for arrest.
The 1977 study had three stated objectives:
1. To evaluate currently used physical coordination tests to determine their relationship to intoxication and impairment
2. To develop more sensitive tests that would provide more reliable evidence of impairment, and
3. To standardize the tests and observations and thus given police more consistent evidence for use in court.
(M. Burns & H. Moskowitz, Psychophysical Tests for DWI Arrest, DOT-HS-5-01242, January 1977)
The six selected tests evaluated in the study are explained below.
· One Leg Stand-The subject must stand with heels together with arms at his sides, raise one leg about 6 inches off the ground, and hold that position for 30 seconds without swaying, using his arms for balance, or putting the foot down.
· Walk-and-Turn-The subject must walk nine steps heel-to-toe in a straight line, turn by pivoting on his left foot, and walk nine heel-to-toe steps back without swaying, stopping, stumbling, using his arms for balance, taking too few or too many steps, or walking in other than a straight line.
· Finger-to-Nose-The subject must stand erect with closed eyes, head tipped back, and hands extended horizontally. He then must touch the tip of the index finger to the tip of the nose, using both the left and right hand as the officer instructs.
· Finger Count-The subject must touch and count each finger in succession counting "1-2-3-4-5, 5-4-3-2-1" out loud.
· Horizontal Gaze Nystagmus (HGN)-The subject must follow the movement of a small light or object without moving his head. The officer looks for jerking of the eyes or "nystagmus" when the moving object is at an angle of 45 degrees or less. Besides determining the angle at which nystagmus begins, the officer also must observe and evaluate any breakdown in smooth eye pursuit of the target and the distinctiveness of the nystagmus at the point at which the eye has moved as far to the side as it will go.
· Finger Tracing-The subject traces a defined figure with his finger and the police officer observes any deviation.
The alternate tests that also were examined in the 1977 study included the Romberg Balance (feet together, arms at sides, eyes closed, and head tilted backwards while the officer observes for body sway), subtraction, counting backward, and letter cancellation tests.
Subjects were all alcohol consumers and were instructed not to eat for four hours prior to the experiments. They were given measured doses of alcohol such that they would have BACs ranging from 0 to .15%, but the tests subjects did not know the amount of the dose each received. Officers had to administer the test package and determine if the person should likely be arrested for having a BAC at or above .10%.
The researchers in the 1977 study concluded that all of the field sobriety tests examined were "alcohol sensitive," but that the walk-and-turn, one-leg-stand, and horizontal gaze nystagmus tests were the most effective at correlating with BACs of .10% or more. They considered these the best tests for further development and validation.
Some of the most significant conclusions the researchers drew are summarized below.
· While all of the tests examined were found to be "alcohol sensitive", that is, performance was affected by alcohol consumption to some degree, they were not all equally accurate.
· The arrest/release decisions made by the police officers were correct for 74% of the test participants with the high rate of false arrest decisions due, in the researchers opinions to the officers adopting a lower level of impairment as a decision criterion than would typically be applied in the field.
· An alternate method of interpreting the subjects' test results using a linear regression statistical technique yielded an 83% correct classification figure.
· The one-leg-stand, walk-and-turn, and HGN tests were considered to be the most accurate and reliable and were recommended for further evaluation as a standardized test battery.
· The HGN test was the most reliable of the three tests with a correlation coefficient of 0.68, compared to 0.55 for the walk-and-turn test and 0.48 for the one-leg-stand test. The combined correlation coefficient for the three-test battery was 0.702. (In
effect, the higher this number is within a range of 0 to 1.0, the more the test elements correlated with identifying subjects with the target BAC of .10% or more).
· If balance and walking skills are examined and the eyes are checked for the jerking nystagmus movement, the officer will have as much information about intoxication level as can be obtained at roadside.
Developing the Standardized Sobriety Field Test Battery (1981)
NHTSA subsequently awarded the Southern California Research Institute researchers a second contract to evaluate only the walk-and-turn, one-leg-stand, and HGN tests as a standardized test battery. The study objectives were to: (1) standardize the administration and scoring procedures for the three-test battery; (2) determine the reliability and validity of the standardized test battery in the laboratory; and (3) assess its feasibility, utility, and validity in the field. (V. Tharp, M. Burns & H. Moskowitz, Development and Field Test of Psychophysical Tests for DWI Arrest, DOT-HS-8-01970, March 1981).
The 1981 study essentially followed the same laboratory test procedure as the 1977 study except that it was limited entirely to these three tests. There were 297 test subjects who were given alcohol doses resulting in BAC levels of 0 to .18%. The researchers standardized the administration guidelines, test instructions, test demonstrations, and scoring criteria with 25 pilot test subjects.
The researchers reported that, on average, the police officers' estimates of the BACs of the people they tested differed by .03% from their actual measured BACs. The officers were able to classify 81% of the test subjects with respect to whether their BACs were above or below the .10% level.
The researchers also conducted a limited three-month field evaluation which resulted in incomplete data to reach any conclusions, but the researchers felt that trends in the field test suggested "positive results will be obtained if the test battery is widely used." They concluded that no further research was necessary to standardize the tests but a more comprehensive field evaluation was necessary and future research should take into account police attitude and motivation, an adequate timeframe for data collection, and numerous issues involved in obtaining law enforcement cooperation for such an effort.
Validating the SFST Battery (1995)
Although there have been several studies attempting to validate the SFST battery under field conditions, the one that is most frequently cited in the literature by those on both sides of the drunk driving enforcement issue is the 1995 Colorado validation study. Funded by NHTSA, the study was conducted for the Colorado Department of Transportation and, once again, the principal researcher was Dr. Marcelline Burns of the Southern California Research Institute. In her introduction to the final report, Dr. Burns makes two notable observations about the previous research that developed the SFTB. First, she notes that it "is clearly relevant" to ask if the methods used in the experiments were scientifically sound, but it should be recognized that the results "are now only indirectly enlightening about current roadside use of the tests." She notes further that controlled laboratory conditions are less variable and therefore "may be less challenging" than the highly varied conditions usually encountered in the field.
Dr. Burns second point about her prior research is that police officer experience with the SFSB is "key to the skill and confidence with which they use them as a basis for their decisions." She observes that the officers who participated in the 1977 and 1981 studies had not been trained in administering and scoring the tests until just before the experiments. Thus they had no time or opportunity to gain skill and confidence in the tests. Since a number of years have passed with police officers gaining experience in using the test battery, she believes it is reasonable to "expect that their decisions based on use of the tests would be more accurate that the officers used in the original research." (M. Burns, A Colorado Validation Study of the Standardized Field Sobriety Test (SFST) Battery, Final Report Submitted to the Colorado Department of Transportation, November 1995, p.1).
She identified the essential question to be examined in the study to be "How accurate are the arrest decisions which are made by experienced, skilled officers under roadside conditions when they rely on SFSTs?" She noted that a broadly applicable answer to this question could not be found in laboratory research and, instead, required field data that provides information about real world arrest decisions made by officers trained under the NHTSA guidelines for administering the test battery.
Volunteers from seven Colorado police agencies submitted records from every administration of the SFST battery over a five-month period. This produced 305 records for evaluation. A significant majority of the records produced for the study were provided in the first two month of the five-month period. The evaluation ultimately considered the correctness of only 234 of the 305 records since only cases for which a BAC was determined by a breath or blood specimen were considered. A subject's BAC was unknown if he was released when no observer was present, or if
an arrested driver refused to provide a specimen (p.11). Dr. Burns notes that breath specimens were obtained "either with instruments approved for evidential tests or with PBTs at roadside (p.13). (PBTs are preliminary breath test devices which are used prior to arrest in some states, but are criticized by some as not reliably accurate.)
The study concluded that for the 234 subjects who provided BAC samples, the police officers decisions to arrest or release were correct in 86% of the cases. Decisions to arrest were correct in 93% of the sample used and decisions to release were correct in 64% of the sample. (It should be noted that the Colorado study included BACs down to .05% in the arrest category since Colorado law at the time defined impaired driving as a BAC of .05% to .099%.)
Criticisms of the Field Sobriety Test Research
Manuals for defense attorneys raise a number of points regarding alleged weaknesses in the research supporting field sobriety tests generally and the SFST battery specifically. These manuals also assert that many subjective factors may intrude on objective administration of the field tests. The manuals cite NHTSA statements in its training documents to the effect that deviation from the standardized procedures for administering and scoring the tests detrimentally affects their accuracy. Among the other factors the manuals identify include the physical conditions of the testing environment, the particular characteristics of the individual, the pressures placed on the individual, the unusual nature of the tests themselves, and the possibility of a police officer's individual predisposition towards arrest affecting his interpretation of driver behavior (Richard Erwin, Defense of Drunk Driving Cases, Chapter 10; Lawrence Taylor, Drunk Driving Defense, Fifth Ed., Chapter 4; John O'Brien, Defending DWI Cases in Connecticut, Second Edition, Section B; Phillip Price, Jr., Field Sobriety Testing, Instructional Material, National College for DUI Defense, Harvard University, July 1996). Other significant research criticizes the SFTB research and attacks their use at trail as a basis for probable cause (Nowaczyk & Cole, Separating Myth from Fact: A Review of Research on Field Sobriety Tests, Champion, Aug. 1995; Simpson, Attacking NHTSA's Three-Test Field Sobriety Assessment, 5 DWI J.: L & Sci 9, 1988; Compton, Pilot Test of Selected DWI Detection Procedures for Use in Sobriety Checkpoints, DOT-HS-806-724)).
Erwin discusses these perceived weaknesses in the research at length in his treatise and some of his major criticisms are briefly summarized below. One of Erwin's major points with respect to the use of field sobriety tests is the apparent contradiction between what they were developed for and how they are admitted by many courts. He states that the primary purpose for developing the SFST battery was to assist the
police officer in making an arrest decision. The tests were correlated with their ability to determine whether a subject's BAC was at least .10% or below .10%. They were not correlated directly with driving impairment nor are they capable of determining if a person's driving ability is actually impaired. To a significant degree, neither the researchers who have conducted most of the seminal research on field sobriety tests or NHTSA itself appear to disagree substantively with this assessment. A recent report on validation of the SFST battery at BACs below .10% states,
"Driving a motor vehicle is a very complex activity that involves a wide variety of tasks and operator capabilities. It is unlikely that complex human performance, such as that required to safely drive an automobile, can be measured at roadside. The constraints imposed by roadside testing conditions were recognized by the developers of NHTSA's SFST battery. As a consequence, they pursued the development of tests that would provide statistically valid and reliable indications of a driver's BAC rather than indications of driving impairment. The link between BAC and driving impairment is a separate issue, involving entirely different research methods. ..." (J. Stuster & M. Burns, Validation of the Standardized Field Sobriety Test Battery at BACs Below 0.10 Percent, Anacapa Sciences, Inc. NHTSA, August 1998, p. 28.)
Erwin states that courts have usually admitted field sobriety test results as evidence of impairment, but not as evidence of a specific BAC, and usually not even as evidence of whether someone's BAC is above a certain level. This, he feels, leads to the apparent contradiction that the courts will not accept the SFST battery for the purpose for which they were developed and the method by which they were validated, but will accept them for purposes for which they have not been directly studied or validated (Erwin, Defense of Drunk Driving Cases, Sec. 10.09(6)).
Some of the other major criticisms in the literature are summarized below. We have presented them as propounded by the critics, but note that counterpoints to these assertions have been made in the literature as well.
· The 1977 study indicates that 47% of the subjects who would have been arrested based on the test battery had BACs less than .10% and that this false positive rate only decreased slightly to 32% in the subsequent 1981 study. Erwin implies that either of these percentages is unacceptably high. He cites a suggestion advanced in by Nowaczyk and Cole that this improvement may have been a bias introduced in the latter study when fewer test
subjects were selected to have BACs near the critical .10% level (22% in the 1981 study compared to almost 33% in the 1977 study) coupled with the easier task of identifying subjects with much higher or much lower BACs (Erwin, Sec. 10-09(6) citing Nowaczyk & Cole, Separating Myth From Fact: A Review of Research on the Field Sobriety Tests, Champion, August 1995, p. 40).
· Test subjects in the original studies were not adequately screened for the presence of drugs which could have affected the behaviors the police officers were observing, particularly with respect to the mistakes made in categorizing test subjects with no or moderate BACs as arrest candidates.
· The test results did not reproduce themselves well and thus are not as scientifically reliable as the researchers claimed. Critics, such as Nowaczyk and Cole, assert that to be considered scientifically reliable, tests should show a reliability coefficient in the high .80s to .90s. (A coefficient at or close to 0 would indicate no reliability or consistency in the test results while one close to 1.0 indicates a very high degree of reliability.) They assert that the test-retest portion of the 1977 study, in which 100 of the original test subjects were brought back for retesting two weeks later by the same officers, yielded a reliability coefficient of only 0.77 which they state indicates that 23% of the variability in test results is due to scoring errors. When the same subjects were tested at the same doses by different officers, the reliability coefficient dropped to 0.57. In the 1981 study, the reliability correlations ranged from .60 to .80.
· The correlation coefficients of the three tests were not sufficiently high to establish them as scientifically valid methods for determining BACs.
· The research developing and standardizing the SFST battery does not establish a baseline level of performance for the test maneuvers that accounts for differences in age, gender, physical stature and condition, and coordination. Critics also assert that the test subject pool in the 1977 and 1981 research was too heavily dominated by males and persons between 21 and 35 years old to be considered reliable in determining what typical test performance should be in the entire population.
· Much of the significantly lower rate of false positives found in the 1995 Colorado validation study (7.4% compared to 47% in the 1977 study and 32% in the 1981 study) can be explained by the
lower BAC arrest criterion of .05% that was necessary under the Colorado law than to training and experience factors associated with the participating police officers.
THE PRE-ARREST ENFORCEMENT PROCESS AND THE ROLE OF FIELD SOBRIETY TESTS
The enforcement process that typically leads up to a drunk driving arrest can generally be separated into three fairly distinct phases. The NHTSA, which establishes training and certification standards for training police officers in drunk driving enforcement identifies them in its training manuals as actions taken by police officers (1) while the vehicle is in motion, (2) during the initial personal contact with the presumed suspect, and (3) the pre-arrest screening process. Administration of field sobriety tests is the main component of this third phase. All three phases generally have the same objective, e.g., to provide the enforcement officer with a basis for determining whether there is probable cause to arrest the suspect for driving under the influence of alcohol.
The NHTSA manual states that each phase represents a set of actions and observations that should be used by the officer to answer three questions. These are:
1. Should I stop the vehicle?
2. Should the driver exit?
3. Is there probable cause to arrest the suspect for DWI?
(DWI Detection and Standardized Field Sobriety Testing, Student Manual, NHTSA Report No. HS 178 R10/95 (1995), Sec. IV-3, Exhibit 4-2)
The manual states that all of the information gathered in these phases is supposed to both assist the officer in the decision making process and gather and accumulate evidence in a form that can be most effectively utilized in court.
Phase I-The Vehicle in Motion
Except when drunk driving enforcement occurs through established sobriety checkpoints or at an accident scene, the first interaction with a police officer occurs when things about a particular vehicle draw the officer's attention and indicate to him that the vehicle should be stopped and investigated. Sometimes this may be unrelated to the driver's actions, such as when there is an obvious equipment defect or an expired registration or inspection sticker. But NHTSA has identified a
number of visual driving cues that it recommends police officers use to associate with alcohol-impaired driving. Because this material is widely distributed to police agencies and included in the recommended NHTSA training program, it generally has become the initial basis upon which they begin to establish probable cause in drunk driving enforcement.
This material was first published in 1981 as Visual Detection of Driving While Intoxicated-An Explanation of the DWI Detection Guide (DOT-HS-805711). It listed 20 driving cues that NHTSA believe its research showed were the best ones for discriminating night-time drunk drivers (.10 BAC or more) from night-time sober drivers. The cues were based on field studies where 4,600 patrol stops were correlated with BAC measurements. NHTSA maintained that the 20 cues could be associated with 90% of all drunk driving detections. The detection guide also assigned a probability to each of the cues purporting to indicate the relative probability that a driver exhibiting the cue was driving with a BAC of .10% or more. But NHTSA cautioned that the probability values were intended primarily to emphasize the relative importance of a particular cue and did not endorse using them when testifying in court.
The probability values ranged from 65% for turning with a wide radius and straddling a center or lane marker line to 30% for driving with headlights turned off or rapidly accelerating or decelerating. Seven of the 20 cues indicated a probability of more than 50%, four indicated a 50% probability, and the remaining nine a probability of less than 50%. But NHTSA also maintained that when more than one cue was observed, the officer should add 10 to the highest probability of an observed cue. For example, observing a driver weaving within a lane or between lanes (50%) and showing too slow a response to a traffic signal (40%) should be interpreted as a 60% probability that the driver had a BAC of .10% or more. Thus the highest probability that could be inferred through these cues was 75%, but NHTSA also asserted that police could use this system for predicting BACs of .05% by adding 15 to the cue's probability value.
NHTSA reissued its visual detection guide in 1998 based on additional field studies it commissioned, ostensibly for the purpose of adapting the guide for BACs down to .08%. It added four additional cues, some of which describe behaviors that could only be observed after the vehicle has been stopped or signaled to stop, revised some of the probability percentages, and included an additional set of post-stop cues that could be used when observing the driver's behavior once the vehicle was stopped.
The new guide is slightly more difficult to interpret than the 1981 version in that it does not list the cues and their probability rating individually.
Instead it groups them into four categories and specifies the range of probabilities within the category. The cue groupings are explained below.
Problems Maintaining Proper Lane Position-50%/75%
Weaving within lane, weaving across lane lines, straddling a lane line, swerving, turning with a wide radius, drifting, or almost striking a vehicle or other object.
Speed and Braking Problems-45%/70%
Stopping problems (too far, too short, or too jerky), accelerating or decelerating for no apparent reason, varying speed, or slow speed (10 mph or more under the speed limit.
Vigilance Problems-55%/65%
Driving in opposing lanes or wrong way on one-way road, slow response to traffic signals, slow or failed response to officer's signals, stopping in lane for no apparent reason, driving without headlights at night, or failure to signal a turn or lane change or signaling that is inconsistent with the action taken.
Judgment Problems-35%/90%
Following too closely, improper or unsafe lane change, illegal or improper turn (too fast, jerky, sharp, etc.), driving on other that the designated roadway, stopping inappropriately in response to officer, inappropriate or unusual behavior (throwing objects, arguing, etc.), appearing to be impaired (slouching, staring straight ahead with eyes fixed, tightly gripping the steering wheel, face close to the windshield, other indicators of appearance consistent with impairment.)
Post Stop Cues-85%
Difficulty with motor vehicle controls; difficulty exiting vehicle; fumbling with driver's license or registration; repeating questions or comments; swaying, unsteadiness, or balance problems; leaning on the vehicle or other object; slurred speech; slow response to officer or necessity for officer to repeat questions; providing incorrect information or changing answers; odor of alcohol.
The reissued detection guide explains the interrelationship of the individual cues differently. It states that if a driver is observed weaving in a lane or across lane lines, there is a 50% probability of a BAC of .08% or more, but if either weaving cue is observed with any other cue, the
probability becomes 65%. Observing two cues other than weaving indicates a probability of at least 50%, although some cues such as swerving, accelerating for no apparent reason, or driving on other than the designated roadway have single-cue probabilities of more than 70%.
Phase II-Personal Interaction with the Driver
The second phase of enforcement is the police officer's face-to-face driver observations and interview and, if the process proceeds further, observations of how the driver exits the vehicle and responds to the officer's directions. Sometimes, the officer may use pre-exit tests aimed at testing the driver's divided attention function or physical condition. This phase of the enforcement process is somewhat less defined procedurally and individualized to the particular officer or department policy. Nevertheless, the general thrust of the encounter is for the officer to elicit responses from the suspect and make observations as to his appearance, demeanor, speech, and attitude that the officer can use to decide on further actions. The NHTSA student training manual states that the driver interview provides the first definite indications that the driver is under the influence (Sec. VI-2). Frequently, the officer will ask the suspect at this point if he has been drinking.
The NHTSA training manual recommends that officers ask certain types of questions that can serve as simple divided attention tests. These can be of three types, specifically: (1) asking for two things simultaneously such as a license and registration, (2) asking interrupting or distracting questions, or (3) asking unusual questions. (Sec. VI-4, -5) In the case of asking for two things simultaneously, NHTSA training procedures instruct the officer to be observant as a possible sign of intoxication if a driver fails to produce both documents; produces other than the requested documents; fails to see the documents while searching in a wallet or purse; fumbles with or drops a wallet, purse, or the requested documents; or is unable to retrieve the documents using the fingertips.
With the second technique, the officer might ask the driver to produce his license and registration and while he is doing this ask him some unrelated question such as the correct time. NHTSA training procedures instruct the officer to be alert to a driver who ignores the question and concentrates only on the initial task of retrieving the documents, forgets to resume the document search after answering the question, or supplies a grossly incorrect answer to the question.
The third technique of asking unusual questions is employed after the driver has retrieved his license and registration. For example, while holding the license the officer might ask the driver for his middle name. The manual states that if he is not expecting to have to process this
information and is impaired, he may have difficulty responding to the unusual question and answer what would be a usual question he is prepared to answer, such as his first name.
The final stage in this phase, if it progresses further, is the vehicle exit sequence. During this phase, the NHTSA training manual instructs the officer to be alert for a driver who shows angry or "unusual" reactions, cannot follow instructions, cannot open the door, leaves the vehicle in gear, "climbs" out of the vehicle, leans against the vehicle, or puts his hands on the vehicle for balance § VI-6).
Phase III-Pre-arrest Screening and Administration of Field Sobriety Tests
This final phase of establishing a basis of probable cause for arrest involves administration of the structured field sobriety tests. In some jurisdictions that allow for them, this can also include administration of a preliminary breath test.
As indicated earlier in this report, NHTSA has developed and promotes the use of the Standardized Field Sobriety Test battery consisting of the Walk-and-Turn (WAT), One-Leg-Stand (OLS), and Horizontal Gaze Nystagmus (HGN) tests. NHTSA recognizes only these tests in its training protocols and does not endorse the use of any other types of field sobriety tests and similarly validated. It also makes it clear that the validity of the test battery depends on strict adherence to the designated administration and scoring principles it has developed. If they are followed exactly, NHTSA asserts that the HGN test is 77% reliable in identifying those with BACs of .10% or more, the WAT test is 68% accurate, and the OLS test is 65% accurate. The HGN test combined with the WAT test is claimed to have 80% reliability. If the procedures are not followed exactly, NHTSA states that "the decision making guidelines will not be accurate."
Failure to pass any of the three tests is determined by counting specific scoring clues NHTSA specifies for each test. Presence of a predetermined number of clues indicates failure to perform the test.
Each of the three tests in the SFST battery is briefly described below, along with the administrative steps that must be followed and the scoring clues applicable to each test. The actual descriptions in the NHTSA manual are considerable more extensive. In addition, the standardized procedures for each test generally require that the officer provide clear and specific directions and demonstrate what the subject must do. Failure to do so invalidates the test effectiveness. The tests
must be administered outside the vehicle in a well-lighted area suitable for walking and standing and safe from traffic.
The Walk-and-Turn (WAT) Test
The test has two distinct parts. The first part (instruction phase) requires the subject to balance heel-to-toe while the officer gives the instructions and demonstrates the test. The second part of the test requires the subject to take nine heel-to-toe steps on a straight line, pivot around, and take nine heel-to-toe steps back.
Test Conditions. The required test conditions are level ground, a hard, dry, non-slippery surface, and conditions under which the suspect is in no danger should he fall. The student training manual states that the test criteria are not necessarily valid for people age 65 or older or people with leg injuries or inner ear disorders. (Prior editions of the manual stated this limitation as applicable to people more than 60 years of age, more than 50 pounds overweight, or with physical impairments that affect balancing ability. The reason for the change does not appear in the manual.) Suspects with heels more than two inches high must be given the chance to remove their shoes. The WAT test requires a line that the suspect can see and follow. If a natural line is not present, the officer must draw one in the dirt or on a sidewalk with chalk. Walking parallel to a curb is not acceptable. The suspect must be able to see to perform the test. His eyes must be open and adequate light available. The manual states that if the officer can see the suspect clearly the lighting is adequate, otherwise the officer must use a flashlight to illuminate the line. A person who cannot see out of one eye may have difficulty performing the test because of poor depth perception. The suspect must watch his feet because this makes the test more difficult for an intoxicated person. The officer must observe the suspect performing the test from three to four feet away and remain motionless. Standing too close or moving while the test is going on makes it more difficult even for a sober person to perform the test.
Standardized Test Procedures. The WAT test must be administered as follows.
· Instruct the subject to place the left foot on the line and the right foot heel-to-toe in front of it (demonstrate).
· Verify that the suspect understands that the stance must be maintained while the instructions are given.
· If the suspect breaks from the stance during the instructions, stop the instructions until the stance is resumed.
· Tell the suspect that he will be required to take nine heel-to-toe steps down the line, turn around, and take nine steps back down the line but not to begin until instructed.
· Demonstrate two or three heel-to-toe steps and the turn.
· Instruct the suspect to keep both arms at his sides, watch his feet, count the steps out loud, and not to stop walking until the test is completed.
· Ask if the suspect understands the directions and, if not, repeat whatever he does not understand but not the entire set of directions.
· Tell the suspect to begin and to count his first step from the heel-to-toe position as one.
· If the suspect staggers, steps off the line, or stops while walking, allow him to resume from the point of interruption. Do not have him repeat the test from the beginning. (The manual states that the test loses its sensitivity if it is repeated.)
Standardized Scoring Clues. The WAT test procedure has eight specific scoring clues the officer must track. The clues must be scored if the suspect:
· Loses balance during the instructions (his feet break from the heel-to-toe stance)
· Starts walking before the instructions are completed and he is instructed to start.
· Stops while walking to steady himself (but do not score this clue if he is only walking slowly).
· Leaves more than one-half inch between his feet during any heel-to-toe step.
· Steps off the line (if this occurs three times the test is terminated and the officer must score it as if all eight clues were shown).
· Raises one or both arms more than six inches from his side to maintain balance.
· Turns improperly either by removing the front foot from the line while turning, removes both feet from the line, or clearly does not follow the directions as demonstrated.
· Takes the wrong number of steps in either direction.
If the suspect cannot do the test, the officer must score it as if all eight clues were present.
If the suspect clearly exhibits two or more of the eight clues or cannot complete the test, the officer must classify his BAC as above .10%. Officers are instructed to note in their report how many times each clue appears, but count it only once for scoring purposes.
The One-Leg-Stand (OLS) Test
The OLS test requires a suspect to stand with his arms at his side and raise and hold one leg at least six inches off the ground for 30 seconds. He must count the seconds out loud according to specific instructions. The 30-second time period is important to the test since NHTSA research indicates that it makes the test sensitive to people in the .10% to .15% BAC range who might otherwise pass the test if they only had to maintain the position for less time. NHTSA research has shown that someone with a BAC above .10% can maintain balance for up to 25 seconds but seldom for 30 seconds.
Test Conditions. The conditions required for the OLS test are like those for the WAT test. There must be light adequate to provide a visual frame of reference. The officer must observe motionless from three to four feet away for the same reasons as for the WAT test. The test criteria are not necessarily valid for people age 65 or older, people 50 pounds or more overweight, or people with leg injuries or inner ear disorders.
Standardized Test Procedures. The NHTSA specified test procedures for the OLS test are as follows.
· Instruct subject to stand with feet together and arms down at sides (demonstrate).
· Tell subject not to start until told.
· Ask if subject understands instructions.
· Explain to the subject that when told to start he must raise one leg, either his left or right, approximately six inches off the ground with the toe pointed out (demonstrate stance).
· Tell the subject he must keep both legs straight with his arms at his side and, while holding the position count out loud for 30 seconds saying "one thousand and one, one thousand and two, etc." until told to stop (Demonstrate the counting method).
· Remind the subject he must keep both arms at his sides at all times throughout the test and keep watching his raised foot.
· Ask if he understands and get a confirmation of his understanding.
· Tell him to begin the test.
· Observe the subject from three feet away and remain "as motionless as possible." If he puts his foot down, instruct him to pick it up again and resume counting from the point it touched the ground. If he counts very slowly, end the test after 30 seconds. If he counts quickly, make him continue until told to stop.
Standardized Scoring Clues. The test is scored according to four scoring clues. If the suspect
· Swaying side-to-side or back-and-forth while maintaining the one-leg stance
· Moving arms six inches or more from the sides to maintain balance
· Hopping in order to maintain the one-leg stance
· Putting his foot down one or more times during the 30 seconds.
If the suspect cannot do the test or puts his foot down three or ore times, the officer must record the results as if all four clues were scored
Horizontal Gaze Nystagmus (HGN) Test
The HGN test is considered the most accurate of the three tests and NHTSA suggests that it be administered at a minimum if the suspect is unable to perform the other two tests due to age, size, or physical limitations. Some of the research on these tests suggests that when it is consistently given first in the test sequence, the reliance some police officers have on it might may have a subtle influence on his expectations and scoring of the other two tests (Anderson, Schweitz, and Snyder, Field Evaluation of a Behavioral Test Battery for DWI, DOT-HS-806-475, September 1983).
Nystagmus is involuntary jerking of the eye. Research shows that there are more than 40 types of eye nystagmus. The HGN test is designed to measure the type of nystagmus that occurs when the eyes gaze to the side. HGN will occur in any person's eyes when gazing extremely sideways, but NHTSA maintains that when a person is intoxicated there are these signs that become apparent in his eye movements: (1) the nystagmus occurs much sooner, that is, the less the persons eyes have to move before the jerking occurs; (2) if the person's eyes move as far to the side as possible, the greater the alcohol impairment, the more distinct the nystagmus will be at the extreme gaze position; and (3) an intoxicated person cannot follow a slowly moving object smoothly with his eyes. The HGN test is intended to identify and measure these three signs.
The key element of measuring HGN is correctly estimating when the eye has reached a deviation angle of 45 degrees. NHTSA maintains that when someone's BAC is above .10%, the jerking will begin before his eye has moved 45 degrees to the side. Officers trained with the NHTSA training procedure are provided a template for practicing how to estimate the 45 degree angle but they are not required to use a template when they administer the test in the field.
Test Conditions. The test requires the use of an object for the subject to follow. The NHTSA training manual says that this can be a fingertip, penlight, or pen. It must be held slightly above eye level and 12-15 inches away from the person's nose. The police officer must inquire and make note of whether or not the suspect if he is wearing contact lenses, but the lenses do not have to be removed for the test. However, a suspect wearing glasses must be made to remove them.
Standardized Test Procedure. The officer must administer the test following these procedures.
· The officer instructs the suspect that he is going to check his eyes, that he must keep his head still and follow the object only with his eyes, and that he must focus on the object until told to stop.
· The officer must hold the stimulus 12-15 inches from the suspect's nose and slightly above eye level. He must move the stimulus smoothly across the suspect's entire field of vision and check to see if the eyes are tracking together or one lags behind the other. (If the eyes do not track together, it could be a sign of a medical disorder, injury, or blindness.)
· The officer next must check to see that both pupils are the same size (if not, it could be a sign of a head injury).
· The officer starts with the left eye and smoothly moves the stimulus to the right at a speed such that it takes about two seconds to being the person's eye as far to the side as it can go. He then moves the stimulus similarly to the left to check the person's right eye.
· Using this process, the officer must check for all three clues in both eyes, always starting with the left. He must check at least twice for each clue in each eye.
· The officer must check for the clues in this sequence: lack of smooth pursuit, nystagmus at maximum deviation, and onset of nytagmus prior to 45 degrees.
· When checking for nystagmus at maximum deviation, the officer must move the stimulus to the side until no white is showing at the side of the suspect's eye and hold the position for four seconds.
· When checking for nystagmus onset angle, the officer must move the stimulus at a speed that would take about four seconds to reach the edge of the suspect's shoulder. Watch the eye for jerking and, when it occurs, stop and verify that is continues.
· The four-second speed of the stimulus movement is important. If the object moves too fast, the officer could go past the point of onset or miss it altogether.
· If the suspect's eyes start to jerk before 45 degrees, the officer must check to see that some white is still showing on the side of the eye closest to the ear. If no white shows, this means either that the officer has taken the eye too far to the side (more than 45 degrees) or the person has unusual eyes that do not deviate very far.
Standardized Clues. There are three scoring clues that are measured for each eye, giving a maximum of six scoring points should all three clues be present in both eyes. If four or more clues are observed, the NHTSA manual states the person should be classified with a BAC above .10%. The are the scoring clues.
· Lack of smooth pursuit (the eyes bounce or jerk as they follow the object)
· Distinct nystagmus at maximum deviation when held for four seconds. While some people exhibit jerking at maximum deviation even when sober, in an intoxicated person the jerking should be "very pronounced, and easily observable."
· Onset of nystagmus before the eye has moved 45 degrees.
These are the only three clues NHTSA recognizes as valid indicators of HGN. NHTSA specifically does not support the position that the exact onset angle can be used to estimate a person's specific BAC and considers this to be a misuse of the HNG test.
Combined HGN and WAT Test Scoring Matrix
NHTSA provides a special scoring matrix for officers to use when combining the results of the HGN and WAT tests. It notes that the HGN test requires four clues for classification as above .10% BAC while the WAT requires only two. The matrix can be used when the suspect scores higher on one test and lower on the other. For example, if the suspect scores three clues on the HGN test but only two clues on the WAT test, the matrix indicates that he should be classified as being above .10% BAC. But if he scores three clues on the HGN test and only one on the WAT test, the matrix shows that his BAC is probably below .10% BAC. The NHTSA manual does not link the OLS test with any other test for combined scoring purposes.
CASE LAW ESTABLISHING ADMISSIBILITY OF FIELD SOBRIETY TESTS
State of Florida v. Meador
We are providing information on this 1996 case from Florida because it is prominent in the literature on field sobriety testing as one of the most significant recent cases addressing the issue of how field sobriety tests are viewed in the courts. It is of particular significance because two of the leading recognized experts in the field with opposing points of view were called to testify as expert witnesses. The state used Dr. Marcelline Burns as its expert and the respondent used Dr. Spurgeon Cole as its expert. Dr. Burns is the researcher from the Southern California Research Institute who conducted the 1977 and 1981 NHTSA studies establishing and standardizing the SFST battery and participated in numerous subsequent studies to support its validity and accuracy. Dr. Cole is a clinical psychologist and professor at Clemson University who has co-authored several critical analytical reviews of field sobriety tests and the research supporting them as noted in the discussion above. The general interest in this case stems from the occasion for the court to
concurrently review the testimony of two of the most recognized experts on field sobriety testing.
State v. Meador (674 So.2d 826, 1996) involves an appeal by the state of a county trial court's pretrial order excluding the evidence of a field sobriety test battery that included the tests in the NHTSA SFST battery and some other tests not in the standardized battery. The Fourth District Court of Appeal exercised it its discretionary jurisdiction to review the issue to the "disparate approaches and conclusions" of county court judges within the district with respect to admissibility of the tests.
The case involved challenges by two defendants arrested for driving under the influence in different Florida towns. Both defendants had challenged the admissibility of the field sobriety test administered to them on the grounds that they lacked both scientific reliability and probative value.
In State v. Meador, the court noted that no Florida appellate court had yet ruled directly on the admissibility of field sobriety test results, but that in 1995 the Florida Supreme Court has ruled in State v. Taylor that a pre-arrest request made to a defendant to perform field sobriety tests after an investigative stop upon reasonable suspicion of DUI was reasonable (674 So. 2d 830).
In rendering its decision the court separated the HGN test from the other tests administered to test psychomotor functions. (The psychomotor tests administered to the defendants included the walk-and-turn, one-leg-stand, Romberg balance, and finger-to-nose tests. The court determined that testimony concerning performance on psychomotor field sobriety tests is sufficiently reliable as lay observations of intoxication to be relevant in proving impairment and the danger that they be unfairly prejudicial did not substantially outweigh their probative value so as to require exclusion as evidence. It considered them admissible as lay observations of the police officer with the proviso that characterization of the test results by witnesses be restricted so as to not elevate the significance of the test result evidence above other lay observations of intoxication. Specifically, the court cautioned that caution should be exercised to restrict use of terms such as "test," "pass," "fail," or "points" when referring to the results.
The court viewed the HGN test in a different light. It determined that HGN test results should not be admitted as lay observations of intoxication because HGN testing constitutes scientific evidence. Thus, although the evidence may be relevant, the court felt that the danger of unfair prejudice, confusion of issues, or misleading the jury requires
exclusion of the HGN test evidence unless the "traditional predicates of scientific evidence are satisfied." (Meador, p. 836).
Connecticut Case Decisions
State v. Lamme (216 Conn. 172, August 1990)
The defendant in this case challenged the admissibility of the results of two field sobriety tests administered to him after he was stopped for driving without lighted headlights at night. Previous to being stopped by the police officer, the defendant had been interviewed by a different police officer called by hotel management to the hotel where the defendant had consumed several drinks and fallen asleep in the lobby. The officer noticed the odor of alcohol on the defendant and when the defendant rejected an offer for arrangement of a ride home and said he would wait in his car for a friend to drive him home. When he observed the defendant walk to his car unsteadily, the officer radioed headquarters with a description of the defendant and his car. The second officer who subsequently stopped the individual heard the broadcast and drove to the vicinity of the hotel where he saw the defendant driving a car matching the description without the headlight illuminated.
The officer administered two field sobriety tests to the defendant-a walk-and-turn test and a finger-to-nose test. While the case decision provides no further description of the content of the tests, it is clear that it did not constitute the SFST battery. The decision states that "the defendant's failure to pass these tests was the basis for his arrest for driving while under the influence of intoxicating liquor." (p. 177)
Both the trial court and the Appellate Court had concluded earlier that the defendant was not entitled to suppress the evidence of the two field sobriety tests. The courts agreed that the police had legally stopped him initially for driving without headlights and, subsequently, the odor of alcohol on his breath provided a "reasonable and articulable suspicion" that he might be involved in criminal activity and justified further detention for the "limited intrusion" represented by the field sobriety tests at the place where he was being detained. The Supreme Court agreed that this constituted a valid stop under the requirements of the U.S. Supreme Court's decision in Terry v. Ohio (392 U.S. 1, 20-22, 88S. Ct. 1868).
In his appeal to the Supreme Court, the defendant asserted that article first, § nine of the Connecticut Constitution forbids the police to detain anyone, even on reasonable and articulable suspicion, unless and until the police have probable cause to make an arrest. This argument would require the court to rule the field sobriety test results inadmissible since
the police had conceded that they did not have probable cause to arrest him until after administering the field sobriety tests.
The Supreme Court rejected this argument and concluded that "the principles of fundamental fairness that are the hallmark of due process permit brief investigatory detention, even in the absence of probable cause, if the police have a reasonable and articulable suspicion that a person has committed or is about to commit a crime." (p.184). Thus the court concluded that the principles underlying constitutionally permissible stops enunciated by the U.S. Supreme Court in its Terry decision and subsequent relevant cases define when detentions are "clearly warranted by law" under article first, § nine of the state constitution.
State v. Merritt (36 Conn. App. 76)
This decision appears to be the first instance a Connecticut appellate court addressed the issue of whether the HGN test and its results are the type of scientific evidence requiring a special foundation for admission. The defendant was initially stopped by police after failing to stop for a stop sign and almost colliding with the car of the arresting officer. The officer suspected the defendant to be intoxicated based on his observation that the defendant's breath smelled of alcohol, his eyes were bloodshot, his clothes disheveled, he swayed back and forth, and he spoke slowly. The police officer conducted three field sobriety tests-alphabet recitation, a ten-step walk-and-turn test, and a one-leg-stand test. Although it is not clear from the case decision if the one-leg-stand test was performed in accordance with the procedures outlined in the SFST battery, the other two tests clearly were not part of the battery.
After concluding that the defendant had failed all three of the psychomotor tests, the police officer performed the HGN test in which he made "three separate observations" of the reactions of each of his eyes. On the basis of all his observations, including those from the HGN test, he took the defendant into custody, but, for several reasons, an evidentiary breath test could not be administered.
At trial, the defendant apparently objected to the admissibility of the results of the HGN test, but not to the admissibility of the other field sobriety tests that were administered. On appeal to the appellate court, the defendant challenged the admissibility of the HGN test results as constituting scientific evidence requiring foundation according to the Frye test of general acceptability within the scientific community. The appellate court noted that no similar court had yet ruled on whether the HGN test constituted scientific evidence requiring special foundation for admission.
After reviewing the plethora of cases on this subject from other jurisdictions, the court determined that the HGN test constituted such scientific evidence and since the state had not laid the foundation for evidence pursuant to the Frye standard, it ruled that the trial court has exceeded its discretion by admitting the HGN test results. However, the court also found that this constituted harmless error and upheld the lower court's conviction based on the conclusion that the jury's perceptions of all of the other evidence, including the defendant's admission of consumption of four drinks, his failure to pass the three other field sobriety tests, and his appearance and demeanor, was not so affected by the improperly admitted testimony on the HGN test that the likely trial result would have been different without the HGN testimony.
State v. Carlson (702 A. 2d 886, 45 Conn. Sup. 461 (1998))
This case further established the specific basis for accepting the HGN test as valid scientific evidence. The court ruled that for purposes of determining if the HGN test had gained general acceptance in the particular field in which it belonged (the essence of the Frye test for acceptability), the relevant scientific communities included optometry, neurology, behavioral psychology, highway safety, and forensic science. The court further found that the test was admissibility as scientific evidence since it was generally accepted in these relevant scientific communities as a reliable indicator of alcohol impairment, it had been the subject of extensive field and laboratory testing and scholarly reivew, national standards existed to guide police officers in executing the test, and it was sufficiently straightforward that a fact finder could reasonably and realistically draw its own conclusions from it. However, the court also reinforced the position that the fact that the HGN test satisfied the standards for admissibility as scientific evidence did not obviate the necessity of laying a proper foundation with a showing that the officer administering the test had the necessary qualifications and followed the appropriate procedures.
State v. Gracia (719 A. 2d 1196, 51 Conn. App. 4 (November 1998))
This case considered several points of law relative to drunk driving issues, but it appears significant with respect the issue of field sobriety test in that it appears to be the first Supreme Court decision specifically to rule on the admissibility of field sobriety tests other than the HGN test as scientific evidence The facts of the case involved a situation where a passing motorist encountered the defendant's vehicle in the left traffic lane of a local street with the engine running, the lights on, the right turn signal flashing, and the radio playing. He observed the defendant asleep in the vehicle and tried to waken him. When he could not do so, he left to call the police and, when he returned, observed the vehicle and
defendant in the same positions as when he left. He made other observations consistent with the idea that the vehicle was running and in gear with the defendant asleep behind the wheel.
When a police officer arrived, he attempted to waken the sleeping defendant for approximately five minutes before succeeding. The police officer testified that the defendant's eyes appeared glassy and bloodshot and that he detected the odor of alcohol. Following several other interactions, the officer asked the defendant to exit the vehicle and, following several additional observations relating to the defendant's condition and demeanor, the officer administered two field sobriety tests, which the decision identified as the one-leg-stand and the walk-and-turn tests.
The defendant raised a number of issues on appeal, one of which was that the judiciary was precluded from exercising jurisdiction in this case because the trial court's suspension of his license violated the separation of powers provision of the Connecticut Constitution. Among the issues raised was that the trial court improperly admitted evidence concerning the field sobriety test he was given in that these tests constitute scientific evidence requiring expert testimony prior to admission.
Before addressing this issue, the court noted that the defendant's claim that Miranda warnings were required before admisintration of field sobriety tests was unfounded because the U.S. Supreme Court had ruled in Pennsylvania v. Bruder (488 U.S. 9, 109 S. Ct. 205) that questioning at the scene and conducting field sobriety tests does not involve custody for Miranda purposes. The court further noted that its previous ruling in the Lamme case considered such testing "incident to the initial stop, based on the officer's reasonable suspicion, rather than on the subsequent arrest."
The court rejected the argument. It ruled that the Frye test for admissibility of scientific evidence did not apply to the field sobriety test administered in this case. It found that the two administered tests assessed the defendant's balance, coordination, and ability to follow directions and that they were neither highly technical nor required special skills or knowledge in order to be understood. The court referred to its previous decision in Merritt in which it noted that these types of tests, unlike the HGN test, were within the common knowledge of lay jurors. It also noted that the trial court instructed the jury that the tests were not scientific evidence and that it should consider the observations made during the tests and use its common experience in determining whether the defendant was intoxicated.
State v. Porter (241 Conn. 57, 698 A. 2d. 739 (1997))
While not specific to field sobriety tests, this decision adopted a new standard with respect to the basis for admitting scientific evidence. It replaced the Frye standard of general acceptance within the relevant scientific community with the standard elucidated in the U.S. Supreme Court's 1993 decision in Daubert v. Merrill Dow Pharmaceuticals. Instead of "general acceptance" within the relevant community, the new federal standard established in Daubert requires only that the reasoning or methodology underlying the scientific theory or technique is scientifically valid and can properly be applied to the facts at issue. "In other words,' the court stated, "before it can be admitted, the trial judge must find that the proffered evidence is both reliable and relevant.'" (Porter p. 64)
In Daubert, the court listed four nonexclusive factors for federal judges to consider in determining whether a particular theory or technique is based on scientific knowledge: (1) whether it can be, or has been, tested; (2) whether it has been subjected to peer review and publication; (3) the known or potential rate of error, including the existence and maintenance of standards controlling its operation; and (4) whether it is, in fact, generally accepted in the relevant scientific community. However, the court also noted that the process was a "flexible" one and that other factors may have merit to the extent that they focus on the reliability of evidence as ensured by the scientific validity of its underlying principles.
In adopting the Daubert criteria as a replacement for the Frye standard, the court further acknowledged the U.S. Supreme Court's recognition that even if a scientific theory or technique satisfied both the reliability and relevance criteria of Daubert, it could still be excluded under federal evidentiary rules if its probative value was substantially outweighed by the danger of unfair prejudice, confusion of issues, or misleading the jury.
Subscribe to:
Posts (Atom)